Low Concentration of Sodium Nitroprusside Promotes Mesenchymal Stem Cell Viability and Proliferation Through Elevation of Metabolic Activity
Avicenna J Med Biochem, 5(1), 9-16; DOI:10.15171/ajmb.2017.02
Research Article
Low Concentration of Sodium Nitroprusside Promotes Mesenchymal Stem Cell Viability and Proliferation Through Elevation of Metabolic Activity
Atefeh Mohammadi, Mohammad Hussein Abnosi ,*, Reza Pakyari
1
Department of Biology, Faculty of Sciences, Arak University, Arak, Iran
*Corresponding Author: Mohammad Hussein Abnosi, Department of Biology, Faculty of Sciences, Arak University, Arak, Iran. P.O. Box: 38156-8-8349; Tel: +989189630568; Email: m-abnosi@araku.ac.ir
Abstract
Background: Sodium nitroprusside (SNP) releases nitric oxide which has signaling role.
Objectives: This study was conducted to understand the role of low concentration of SNP on viability,
proliferation and biochemical properties of rat bone marrow mesenchymal stem cells (MSCs).
Materials and Methods: MSCs were used to evaluate the viability and morphology in presence of SNP (1
to 100 µM) at 12, 24 and 36 hours. Then 10, 50 and 100 µM of SNP as well as 24 hours were selected for
further study. Cell proliferation was investigated by colony forming assay and population doubling number
(PDN). Calcium (Ca2+) potassium (K+) and sodium (Na+) level as well as activity of alanine transaminase
(ALT), aspartate transaminase (AST), alkaline phosphatase (ALP) and lactate dehydrogenase (LDH) were
measured.
Results: The MSCs viability increased when treatment with 1 and 10 µM at all the treatment periods
while 90 and 100 µM caused significant reduction after 24 and 36 hours. Also 10 µM caused elevation
whereas 50 and 100 µM showed reduction of proliferation ability. We observed morphological changes
and significant reduction of all the investigated enzymes with 100 µM. Activity of ALT and AST were
elevated with 10 µM after 24 hours, whereas LDH and ALP activities were not changed. Na+, K+ and Ca2+
was not changed due to 10 and 50 µM treatments, whereas 100 µM only elevated the level of calcium
and sodium ions.
Conclusions: Low concentration of SNP caused increase of viability and proliferation due to metabolic
activity elevation. But the high concentration of SNP induced cell viability and proliferation reduction
caused by metabolic and ionic imbalance as well as infrastructure alteration.
Keywords: Mesenchymal stem cells, Morphology, Nitric oxide, Nitroprusside, Transaminases, Viability
Background
Nitric oxide (NO), a lipophilic diatomic molecule (1) is formed by different NO synthases (NOS) namely endothelial (eNOS), inducible (iNOS) and neuronal (nNOS) governing the L-arginine to L-citrulline reaction in the cell (2). NO with an approximate half-life of 0.05–1 seconds is transferred across the cell membrane and is very stable under physiological conditions (3). Depending on its concentration and tissue localization, NO acts as an important signaling molecule to govern numerous physiological processes such as cell proliferation (4), survival (5), apoptosis (6), inflammatory responses (7) as well as cell differentiation (8). At low concentrations (<1 μM) via activation of guanylate cyclase, NO affects different transcription factors, whereas at higher concentrations (>1 μM) it results in chemical reactions which modifies the cellular function to cause the cellular damage (9).
In biological systems, NO can be formed by its exogenous donors, which somehow might induce NO-related activity at low concentration or cause cellular damage when its concentration is high (9). Sodium nitroprusside (SNP), which releases NO spontaneously (10) has been used in clinical practice as an arterial and venous vasodilator for more than 40 years (11). Following NO production, SNP also releases cyanide (12) which is a potent inhibitor of complex IV of the mitochondrial electron transport chain (10). Depending on the SNP concentration, the level of NO production also differs, which means that at high concentration, the level of NO might not be tolerated by biological system and it would cause cellular toxicity (13). But some evidence indicates that NO at physiological concentration plays an important role in osteoblasts growth and matrix formation (14,15). It was revealed that in the osteoblasts the NO is produced by iNOS and eNOS (16), therefore NO can be considered as a vital molecule in the bone health.
In a report, Chen et al used osteoblasts and treated them with 1.5 and 2 mM SNP which showed 29% and 58% cell death respectively, whereas no cytotoxic effect on the cell was observed with SNP at <1 mM. Also they have shown that the SNP at 0.5, 1.0, 1.5 and 2 mM decreased 24%, 52%, 55% and 59% of ALP activity in osteoblasts respectively (17). In another study, Chen et al reported that administration of 2 mM of SNP in osteoblasts culture led to significant increase in DNA fragmentation, significant decrease in mitochondrial membrane potential and activity of NADH dehydrogenase (complex I), significant reduction of adenosine triphosphate (ATP) production and significant increase in the level of intracellular reactive oxygen species (18). In addition to above-mentioned investigations, many other investigators also have concluded the same results with respect to toxic effect of SNP on osteoblasts. They have revealed, significant reduction of cell viability (19), complete blockage of Runx2 expression (20), increase in cell apoptotic morphology and nuclear chromatin condensation as well as DNA fragmentation (21) and also increase in the levels of intracellular ROS (22).
Proliferation and differentiation are the important abilities of stem cells which make them able to self-multiply and produce multiple cell lineages. Bone marrow mesenchymal stem cells (MSCs) participate in bone homeostasis and repair via differentiation to osteoblasts (23). Therefore they are considered as cellular backup for production of these cells. Chu et al found that the treatment of adult mouse bone marrow multipotent progenitor cells with 500 to 2000 µM of SNP for 48 hours caused significant reduction of cell proliferation (24). Also Felka et al showed that 10 and 25 μM of SNP for 24 hours caused activation of respiratory activity of human bone marrow MSCs to some extent. But respiratory activity of MSC was reduced due to the treatment with 100-500 μM of SNP approximately up to 80% and the reduction was 30% or 20% due to 1 mM SNP or higher (20).
Objectives
Previous investigations showed that the high concentration of SNP was harmful to both osteoblasts and MSCs, whereas low concentration (<100 µM) was not toxic and might even be beneficial to them. Therefore in the present investigation we aimed to study the effect of low dose of SNP as NO releasing agent on the viability, proliferation, morphology, metabolic state and electrolyte level of the rat bone marrow MSCs.
Methods and Materials
Bone Marrow Cell Culture
In the present experimental study, we purchased 6-8 week-old Wistar rats from Pastor Institute (Tehran, Iran) and kept them under standard condition of light, temperature and food in the animal house of Arak University. The animals were sacrificed according to the animal laboratory protocol approved by Arak University, with excessive chloroform inhalation. Then the femora and tibia of each rat were removed in an aseptic condition and the bone marrow content was flashed-out using 3 mL of Dulbecco modified Eagle medium (DMEM) (Gibco, Germany) containing 15% FBS (Gibco, Germany) and penicillin-streptomycin (Gibco, Germany). Following centrifugation of the bone marrow content at 2500 rpm for 5 minutes, it was re-suspended in 5 mL fresh culture media and plated in culture flasks then incubated at 37°C and 5% CO2. One day after culture initiation, the first medium replacement was performed and then the medium replacement was carried out two times a week till the bottom of the flask was covered with the cells. The cells were trypsinized (trypsin-EDTA, Gibco, Germany) and detached from the flask then it was divided and passed to another culture flask as the first passage. The cultures were expanded through two additional subcultures at which the cells were used for further investigation.
Exposure to Sodium Nitroprusside
The cells were cultured in appropriate dish and allowed to attach for 24 hours, then the cells were exposed to 1, 10, 20, 30, 40, 50, 60, 70, 80, 90 and 100 μM of SNP (Merck Company, Germany). Based on the nature of the test and area of the culture dish, the number of the cells in each plate and time of exposure was calculated. The details are provided wherever necessary in descriptions of the assays below.
Cell Viability Assays
Trypan Blue Exclusion Assay
MSCs were seeded at a density of 50 000 per well in 24-well culture plates and then the plates were treated with different concentration of SNP. After treating the cells for 12, 24 and 36 hours, the contaminated culture media was removed and exchanged with fresh culture media. The cells were washed by adding phosphate buffered saline (PBS), harvested with trypsin/EDTA and centrifuged at 2500 rpm for 5 minutes. The cells were re-suspended in 1 mL of fresh media, then 50 μL of the suspended cell was stained with 50 μL trypan blue (sigma company, Germany) follow by incubation for 2 minutes at 37°C. The total number of viable cells was estimated using hemocytometer chamber.
3-(4,5-Dimethy Thiazo-2-yl)-2,5 Diphenyltetrazolium Assay
Cell viability was also quantitatively determined by 3-(4,5-dimethy thiazo-2-yl)-2,5 diphenyltetrazolium (MTT) assay. The MSCs were cultured in a sterile Elisa plates at a density of 15 000 cells per well then the SNP treatment was carried out the same as previous test. After treatment period the cells were rinsed with PBS then 10 μL of MTT/100 μL of FBS free culture media were added and the plate was kept in an incubator for 4 hours. Viable cell converted the yellow tetrazolium to blue crystal of formazan by mitochondrial succinate dehydrogenase enzyme. Adding 100 μL of DMSO (Sigma Company, Germany) the resulting crystals of formazan were dissolved and absorbance was measured at 505 nm using ELISA reader (SCO diagnostic, Germany). The number of viable cells were calculated using the linear formula Y=0.013X+0.007 with R2=0.996 where Y stands for absorbance and X stands for number of the viable cells.
Based on the viability results, the 10, 50 and 100 µM of SNP were chosen as representative of broad range of concentrations. Treatment time based on the nature of the analysis was different and mentioned wherever necessary.
Quantification of Proliferation Ability
The proliferation ability of the cells was quantified after third passage with the help of colony forming assay and the population doubling number (PDN).
Colony Forming Assay
The colony forming ability was carried out where 5×10⁴ cells were separately seeded in 3 cm sterile plates. After treating the cells with 10, 50 and 100 µM of SNP, the plates were washed and supplied with fresh media. The plates were incubated for 7 and 14 days, to ensure that the supplement of nutritive material, and culture media replacement was carried out every 3 days. Then, after rinsing the plates with PBS, crystal violet staining (0.5 g crystal violet in 100 mL methanol solution) was performed and the diameter (μm) and number of the colonies were estimated using light microscope equipped with eyepiece graticule.
Population Doubling Number
To estimate the PDN, 5×10⁴ cells were separately seeded in 3 cm sterile plates. After treating the cells with 10, 50 and 100 µM of SNP, the plates were washed and supplied with fresh media. Following that, the incubation of the plates was carried out for 5, 10 and 15 days with every three days of culture media replacement. After washing the plate with PBS, cells were harvested with trypsin-EDTA, and the number of the cells was counted using hemocytometer chamber. Using the equation PDN = logN/N0×3.31; the population doubling of the cells was calculated. In the above-mentioned formula N0 is the initial number of the cells seeded and N is the number of the cells at the end of culture period.
Morphology
The attached MSCs in a 12 well plate were treated with 10, 50 and 100 µM of SNP for 12, 24 and 36 hours. The contaminated media was removed and exchanged with fresh culture media. The cells were rinsed with PBS and then 10 μL of Hoechst (50 µg/mL) (Sigma Company, Germany) per every 100 μL of PBS was added and the samples were incubated for 15 minutes at room temperature to stain the chromatin. Furthermore, to study the morphology of the cell cytoplasm, attached cells were incubated with 10 μL of acridine orange (5 µg/mL) per 100 μL of PBS for 2 minutes separately. The cells after staining with Hoechst and acridine orange were observed under inverted fluorescence microscopy (Olympus, IX70) equipped with a camera (DP72) using ×200 magnification. In addition, with the help of Motic Images software (Micro optical group company version 1.2) the nuclei diameter and cytoplasm area of the control and treated cells were measured in μm.
Preparation of Cell Extract
Control and treated cells with 10, 50 and 100 µM of SNP was washed with PBS and incubated for 24 hours. Then the cells were harvested with trypsin/EDTA follow by centrifugation at 2500 rpm for 5 minutes. After twice washing with Tris-HCl-NaCl, the cells were homogenized in lysis buffer (20 mM Tris-HCl, pH 7.2) and kept in -20oC overnight followed by centrifugation at 12000 g for 10 minutes to extract the intracellular content. Using Lowry method, the total protein content of each sample was determined. To prepare standard graph, different concentration of bovine serum albumin (BSA) was used and a standard plotted was drawn. Then using linear formula Y=0.001X+0.063 with R2=0.990, the concentration of the unknown protein samples was calculated. In the above-mentioned formula Y is the absorbance and X is the protein concentration (μg) in each sample.
Determination of Transaminase and Lactate Dehydrogenase Activity
We determined the activities of the enzymes alanine transaminase (ALT), aspartate transaminase (AST), and lactate dehydrogenase (LDH) in protein lysate using a commercial kit (Pars Azmoon, Iran) according to manufacturer’s instructions. Absorbance was measured at 340 nm using a spectrophotometer (T80+, PG Instrument Ltd., England) based on an equal amount of protein.
Determination of Alkaline Phosphatase Activity
Alkaline phosphatase (ALP) activity was determined using a spectrophotometer (T80+, PG Instrument, Ltd., England). The enzymatic activity was carried out in protein lysate based on an equal amount of protein using p-nitrophenyl phosphate (pNPP) as the substrate according to the kit’s instructions (Pars Azmoon, Iran). The instrument absorbance was adjusted to 410 nm and the sample measurement was carried out in the presence of a blank.
Intracellular Ca2+ Assay
Calcium content of the samples were determined at 570 nm using spectrophotometer (T80+ PG instrument ltd, England) based on the instruction given in the commercial kit (Pars Azmoon, Iran). A standard graph was plotted and the concentration of unknown samples was calculated based on different concentration of calcium chloride using linear formula Y=0.0763X-0.0039 with R2=0.998. In the above-mentioned formula Y is the absorbance and X is the concentration (mg/dL) of calcium.
Determination of Sodium and Potassium Level
We have estimated the amounts of Na+ and K+ in the cell extract using a flame photometer (Model PFP7, England). In a flame photometer, Na+ and K+ emit light at different wavelengths. The emission can be measured using appropriate filters, which is correspondent to the respective concentrations. We used the same instrument and different concentrations of NaCl and KCl to plot a standard graph. The linear formula Y=0.005X+0.0592 with R2=0.992 where Y=0.0201X+0.0039 with R2=0.996 were obtained for Na+ and K+. Here, Y represented the absorbance, where X was the concentration of each one of the electrolytes.
Analysis of Data
Data was analyzed with SPSS software, using one-way analysis of variance (ANOVA), Tukey test, and the significance level was taken at P < .05.
Results
Effect of Sodium Nitroprusside on Cell Viability
Based on trypan blue assay, the results of present study showed no significant reduction (P > .05) of cell viability at 12 hours. Treatment of the cells with SNP caused significant reduction (P < .05) of viability in 90 and 100 µM at 24 hours, as well as 80, 90 and 100 µM at 36 hours as compared with control. But a significant increase was observed with 1 and 10 µM at all the treatment periods (12, 24 and 36 hours) when compared with control group (Table 1).
|
Table 1.
Percentage of Viable Mesenchymal Stem Cells After 12, 24, 36 Hours of Treatment With SNP Based on Trypan Blue Staining Assay
|
|
Doses (µM)
|
Hours
|
|
12
|
24
|
36
|
| 0 |
95.00a± 0.00 |
95.40a± 0.52 |
94.50a ± 0.50 |
| 1 |
97.50b ± 0.50 |
97.83b ± 0.28 |
97.00b ± 1.00 |
| 10 |
97.16b ± 0.50 |
97.66b ± 0.57 |
97.00b ± 0.50 |
| 20 |
96.50ab± 0.50 |
96.80ab ± 0.15 |
95.16ab ± 0.28 |
| 30 |
96.00ab± 0.28 |
95.83ab ± 0.76 |
94.50a± 0.50 |
| 40 |
95.50a± 0.50 |
95..33a ± 0.57 |
94.16a ± 0.76 |
| 50 |
95.33a± 0.57 |
95.00a ± 0.57 |
93.50a ± 0.51 |
| 60 |
95.00a± 1.04 |
94.73a± 0.25 |
93.00a ± 1.00 |
| 70 |
94.50a ± 0.50 |
94..33a± 0.57 |
92.83a ± 0.29 |
| 80 |
94.42a ± 0.52 |
94.00a ± 0.50 |
92.16c ± 0.76 |
| 90 |
94.16a ± 0.28 |
92.50c± 0.50 |
90.83c± 0.76 |
| 100 |
93.66a ± 0.58 |
91.50c ± 0.50 |
89.00c ±1.00 |
|
Means with the different letter code in each column differ significantly from each other (ANOVA, Tukey test, P < .05). Values are means ± SD.
|
The viability of MSCs based on MTT assay also confirmed the results based on trypan blue staining method. In the groups of cell treated for 12 hours, no significant differences (P > .05) was observed between doses from 20 to 100 µM when compared with the control group, but the significant differences (P < .05) was observed at 90 to 100 µM as compared with control in group treated for 24 hours as well as 80, 90 and 100 µM in group treated for 36 hours. The significant increase (P < .05) also was observed at 12, 24 and 36 hours with 1 and 10 µM (Table 2).
|
Table 2.
Number of Viable Mesenchymal Stem Cells (×103) After 12, 24, 36 Hours of Treatment With SNP Based on MTT Quantitative Assay
|
|
Doses (µM)
|
Hours
|
|
12
|
24
|
36
|
| 0 |
29.00a ± 1.09 |
29.95a ± 0.95 |
30.40a ± 1.15 |
| 1 |
33.22b ± 1.19 |
33.83b ± 0.76 |
33.50b ± 0.50 |
| 10 |
33.00b ± 0.77 |
33.08b ± 0.93 |
33.17b ± 0.21 |
| 20 |
30.31ab ± 1.47 |
32.02ab ± 0.77 |
31.84ab ± 0.77 |
| 30 |
30.54ab ± 1.69 |
31.79ab ± 0.71 |
31.60ab ± 0.53 |
| 40 |
29.37a ± 0.60 |
30.00a ± 0.43 |
29.43a ± 1.25 |
| 50 |
29.14a ± 0.71 |
29.84a ± 0.76 |
29.29a ± 1.27 |
| 60 |
28.52a ± 1.00 |
28.24a ± 0.85 |
28.42a ± 0.32 |
| 70 |
28.21a ± 0.34 |
28.14a ± 0.27 |
28.12a ± 0.11 |
| 80 |
28.07a ± 0.52 |
28.13a ± 0.31 |
27.41c ± 0.60 |
| 90 |
27.00a ± 0.50 |
25.81c ± 0.73 |
25.38c ± 0.54 |
| 100 |
26.56a ± 0.55 |
25.57c ± 0.44 |
25.00c ± 0.83 |
|
Means with the different letter code in each column differ significantly from each other (ANOVA, Tukey test, P < .05). Values are means ± SD.
|
Colony Forming Assay
Analysis of data showed, treatment of the cells with 50 and 100 µM caused number and diameter of the colonies to reduce highly significantly (P < .001) at the days 7 and 14. Although the numbers and diameter of colonies significantly increased due to the treatment with 10 µM of SNP at 7 days, but no significant change was observed in number and diameter of the colonies at 14 days (Table 3). Macroscopic and microscopic observation of colonies also confirmed the quantitative data (Figure 1).
|
Table 3. Mean Number and Diameter (mm) of the Colonies after 7 and 14 Days of Treatment With 10, 50 and 100 µM of SNP in Comparison With the control
|
|
Doses (µM)
|
Hours
|
|
7 Days
|
7 Days
|
14 Days
|
14 Days
|
|
No. of the Colonies
|
Diameter (mm) of the Colonies
|
No. of the Colonies
|
Diameter (mm) of the Colonies
|
| 0 |
73.66a ± 1.52 |
2.15a ± 0.8 |
101.00a ± 2.52 |
2.98a ± 0.12 |
| 10 |
87.33b ± 1.52 |
2.69b ± 0.14 |
98.66a ± 1.52 |
2.91a ± 0.07 |
| 50 |
65.66c ± 2.08 |
1.79c ± 0.11 |
56.00b ± 2.00 |
1.37b ± 0.14 |
| 100 |
43.00d ± 2.00 |
1.25d ± 0.61 |
31.66c ± 2.08 |
1.07c ± 0.06 |
|
Means with the different letter code in each column differ significantly from each other (ANOVA, Tukey test, P < .05). Values are means ± SD.
|
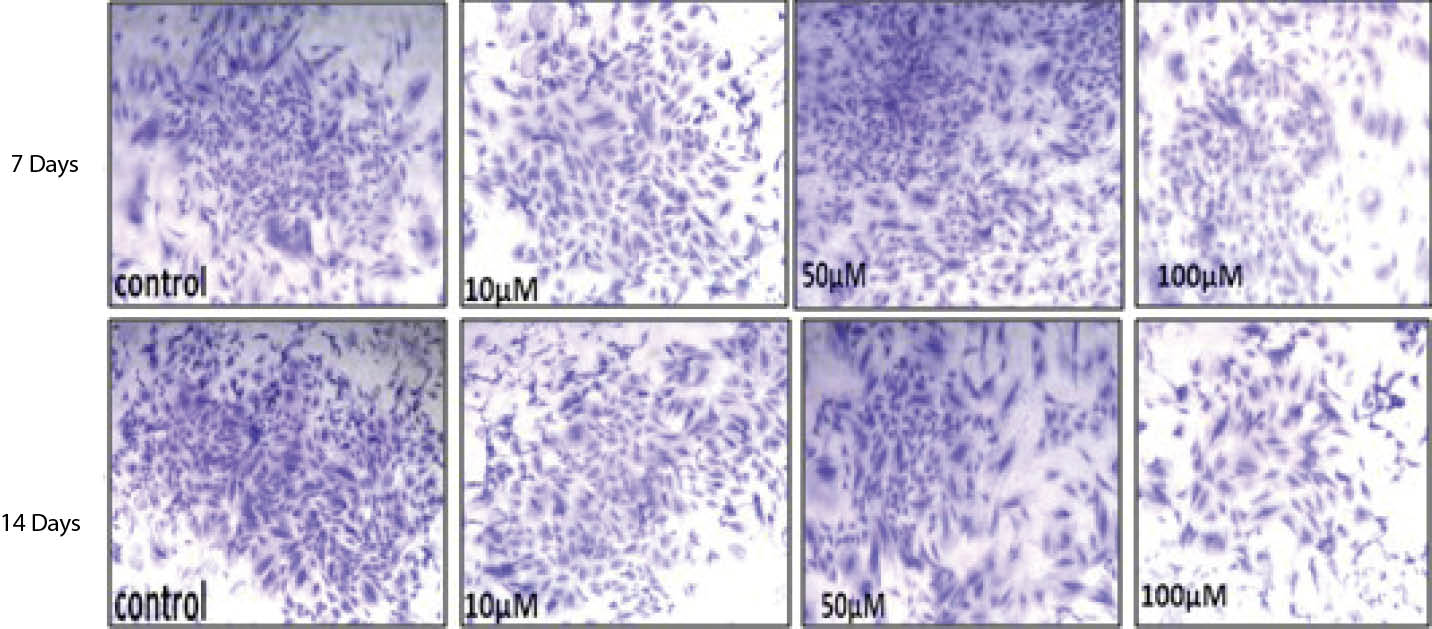
Figure 1. Photograph Showing the Differences Between the Colony Size in Control and Treated Groups Following Treatment With Different Concentration of SNP
After 7 and 14 Days. (A) Control, (B) 10 μM, (C) 50 μM and (D) 100 μM.
Population Doubling Number:
SNP in 100 µM caused significant reduction (P < .05) of MSCs PDN in day 5, 10 and 15, whereas 50 µM only caused significant reduction at 10 and 15 days. Treatment with 10 µM of SNP caused significant increase (P < .05) at 5 days, but no changes was observed at 10 and 15 days (Table 4).
|
Table 4.
Percentage of Viable Mesenchymal Stem Cells After 12, 24, 36 Hours of Treatment With SNP Based on Trypan Blue Staining Assay
|
|
Doses (µM)
|
Hours
|
|
5
|
10
|
15
|
| 0 |
1.92a ± 0.03 |
3.77a ± 0.06 |
4.96a ± 0.03 |
| 80 |
2.98b ± 0.11 |
3.91a ± 0.04 |
4.85a ± 0.05 |
| 90 |
1.73a ± 0.04 |
2.00b ± 0.06 |
2.38b ± 0.07 |
| 100 |
1.06c ± 0.06 |
1.32c ± 0.05 |
0.99c ± 0.05 |
|
Means with the different letter code in each column differ significantly from each other (ANOVA, Tukey test, P < .05). Values are means ± SD.
|
Morphology of the Cells
Study of the morphological showed no significant change (P > .05) in the nuclei diameter and cytoplasm area of MSCs treated with 10 and 50 µM of SNP at 12, 24 and 36 hours. Treatment of cells with 100 µM caused significant reduction (P < .05) of nuclear diameter and cytoplasm area at 24 and 36 hours, whereas at 12 hours only cytoplasm area was significantly reduced and no change was observed in nuclei diameter (Table 5). The results of nuclear and cytoplasm morphology was also confirmed by microscopic analysis, where treatment with 100 µM showed chromatin condensation, nuclear breakage and cytoplasm shrinkage as well as disappearance of cytoplasm in some cells (Figure 2D and 3D).
|
Table 5.
Mean Diameter (µm) and Cytoplasm Area (µm2) of Mesenchymal Stem Cells After 12, 24 and 36 Hours of Treatment With 10, 50 and 100 µM of SNP as Compared With Control
|
|
Doses (µM)
|
12 Hours
|
24 Hours
|
36 Hours
|
|
Nucleus Diameter (µm)
|
Cytoplasm Area (µm
2
)
|
Nucleus Diameter (µm)
|
Cytoplasm Area
(µm
2
)
|
Nucleus Diameter
(µm)
|
Cytoplasm Area
(µm
2
)
|
| 0 |
12.00a ± 0.10 |
3998.00a ± 10.58 |
12.03a ± 0.06 |
4000.67a ± 6.02 |
12.00a ± 0.08 |
4004.33a ± 9.45 |
| 10 |
12.15a ± 0.14 |
4002.33a ± 11.67 |
12.13a ± 0.12 |
4004.00a ± 7.21 |
12.09a ± 0.08 |
4002.00a ± 8.73 |
| 50 |
11.99a ± 0.09 |
3992.33a ± 6.80 |
11.95a ± 0.07 |
3997.33a ± 5.03 |
11.88a ± 0.06 |
3987.67a ± 2.08 |
| 100 |
11.80a ± 0.04 |
3793.66b ± 9.07 |
10.97b ± 0.11 |
2980.33b ± 13.42 |
10.48b ± 0.10 |
2953.00b ± 6.24 |
|
Means with the different letter code in each column differ significantly from each other (ANOVA, Tukey test, P < .05). Values are means ± SD.
|
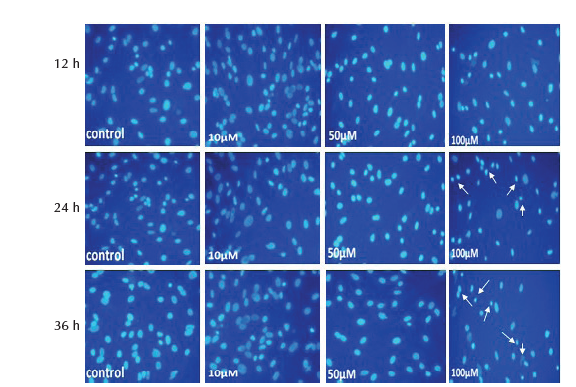
Figure 2. MSCs Stained With Hoechst, After Treatment With 10, 50 and
100 μM of SNP for 12, 24 and 36 hours. Nuclear condensation and DNA
fragmentation (arrows) of cells was observed after treatment with 100 μM
(×200 magnification).
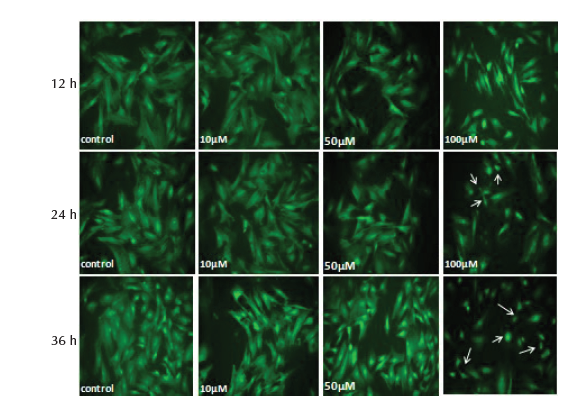
Figure 3. MSCs Stained With Acridine Orange, After 12, 24 and 36 Hours
of Treatment With 10, 50 and 100 μM of SNP. Shrinkage and complete
cytoplasm disappearance in some cells (arrows) was observed after treatment
with 100 μM (×200 magnification).
Intracellular Na+, K+ and Ca++ Concentration
Treatment with 10 and 50 µM of SNP caused no significant changes (P > .05) in intracellular calcium, sodium and potassium content as compared with control, while we found significant increase (P < .05) in intracellular calcium and sodium as well as significant decrease (P < .05) in potassium concentration in comparison with control group when the cells were treated with 100 µM (Table 6).
|
Table 6.
Effect of SNP on Intracellular Calcium, Sodium and Potassium Concentration After 24 Hours of Treatment With 10, 50 and 100 µM of SNP as Compared With Control
|
|
Doses (µM)
|
Intracellular Electrolytes
|
|
Ca
++
(mg/dL)
|
Na
+
(µg/mL)
|
K
+
(µg/mL)
|
| 0 |
1.15a ± 0.15 |
72.33a ± 1.52 |
5.00a ± 0.09 |
| 80 |
1.07a ± 0.04 |
70.00a ± 1.00 |
5.02a ± 0.05 |
| 90 |
1.17a ± 0.03 |
73.33a ± 1.50 |
5.01a ± 0.07 |
| 100 |
2.39b ± 0.073 |
86.00b ± 2.00 |
3.07b ± 0.056 |
|
Means with the different letter code in each column differ significantly from each other (ANOVA, Tukey test, P < .05). Values are means ± SD.
|
Metabolic Activity of the Cells
The MSCs treated with 10 μM of SNP showed significant increase (P < .05) in the activity of transaminase enzymes (ALT and AST) as compared with control group. On the other hand, the treatment of the cells with 100 μM of SNP caused significant decrease (P < .05) in the ALT and AST activity whereas no significant change was observed in the group of cells treated with 50 μM of SNP (Table 7).
|
Table 7.
Mean Activity of AST, ALT, LDH and ALP After 24 Hours of Treatment With 10, 50 and 100 µM of SNP as Compared With Control
|
|
Doses (µM)
|
Enzymes Activity (IU/L)
|
|
AST
|
ALT
|
LDH
|
AP
|
| 0 |
101.66a ± 2.51 |
6.36a ± 0.40 |
1374.00a ± 5.00 |
293.33a ± 5.50 |
| 80 |
128.00b ± 3.60 |
8.40b ± 0.11 |
1364.00a ± 11.33 |
287.70a ± 2.08 |
| 90 |
96.00a ± 1.52 |
5.74a ± 0.21 |
1369.33a ± 3.21 |
291.00a ± 4.00 |
| 100 |
56.00c ± 2.64 |
2.50c ± 0.34 |
2422.67b ± 3.60 |
250.00b ± 3.05 |
|
Means with the different letter code in each column differ significantly from each other (ANOVA, Tukey test, P < .05). Values are means ± SD.
|
Data analysis showed that the activity of LDH following treatment with 100 μM SNP caused a significant increase (P < 0.05) as compared with control group. Lower dose of SNP (10 and 50 μM) showed no significant effect on the activity of LDH (Table 7).
Activity of ALP in the MSCs treated with 100 μM SNP caused a significant decrease (P < 0.05), but no effect was observed with 10 and 50 μM SNP when compared with control group (Table 7).
Discussion
In a study by Felka et al, it was shown that the treatment of human bone marrow MSCs with low doses (10 and 25 µM) of SNP significantly increased respiratory activity after 24 hours (20). Whereas the same author and Chu et al, separately investigated the effect of SNP (100 to 2000 µM) on human bone marrow MSCs and adult mouse bone marrow multipotent progenitor cells, they found that these treatments caused a concentration dependent reduction of respiratory activity and proliferation ability in 24 and 48 hours respectively (20,24). Two concepts might be pointed out; the first one is that in both of the studies, all the high concentrations caused significant reduction in viability and proliferation, although in the Chu et al report, no significant change was mentioned with respect to 100 µM treatment after 48 hours. It is well known that, in addition to NO, SNP would release cyanide (CN) too (25). Since the released concentration of NO and CN from SNP depends on its concentration, the higher the concentration of SNP, the more NO and CN would be released (12). Investigations have shown that the high concentrations of NO and CN are toxic and cause the cellular death, but low concentration of them can be tolerated by cell (12). The harmful effects of SNP at high concentration are well documented (17,18,20,24) and also quite obvious in the data (100 µM) of the present study with respect to proliferation, morphological and biochemical study. The other is that the low concentrations of SNP (10 and 25 µM) not only showed no negative effect on cellular respiration, but also had positive advantage. Although the NO is produced in the cells and at physiologic concentration, it promotes cellular functions (26,27). And whether the low concentration of SNP as a source of exogenous NO releasing agent can be beneficial to cells was investigated by following experiment.
Based on trypan blue staining and MTT assay, our study showed that the viability of MSCs treated with 10 µM of SNP in 12, 24 and 36 hours significantly increased whereas no change was observed with respect to 50 µM as compared with control group. Trypan blue is a dye which cannot pass through the intact cell membrane, and enters the cell if the membrane is damaged (28). Also crystallization of yellow formazan is due to its reduction by dehydrogenase enzymes such as succinate dehydrogenase (complex II) which is a component of electron transfer chain (29). Therefore, these 2 tests showed that the membrane integrity was completely intact at low concentration of SNP and the cellular metabolism increased with 10 µM treatments. Integrity of the cell membrane depends on the electrical potential which exists across the membrane (30). In addition, the membrane potential itself is maintained when the electrolytes of the cell is well balanced (31). Our analysis showed that the treatment of the cells did not cause any imbalance in the electrolyte level at all either with 10 µM, or 50 µM of SNP, thus the absolute health of the membrane might be expectable. The morphological study also confirms that the membranes are well maintained either in nuclei or cytoplasm. Regarding the elevation of cell respiration, the enzymatic analysis revealed significant elevation in ALT and AST following treatment with 10 µM of SNP. Since the Krebs cycle is the main metabolic process which feed the electron transport chain with electron carriers (NADH+H+ and FADH2) (32), further entry of its intermediate, especially oxaloacetate, is an important task. In the situation where the energy demand of the cell increases, break down of carbohydrates and fats provide more acetyl-CoA, whose entry to Krebs cycle needs more of oxaloacetate. Transamination enzymes (ALT and AST) which are involved in amino acid metabolism can generate more of oxaloacetate by converting glutamate to alpha-ketoglutarate and further conversion of aspartate to oxaloacetate in a consecutive reactions when the pyruvate is converted to alanine (33). Therefore the elevation of cell metabolism can be explained by the elevation of cell respiration after treatment with 10 µM of SNP which produce more ATP as energy currency of the cell. Proliferation assay with respect to PDN and CFA proved that the cells have been well provided with ATP, which is needed to govern the production of material necessary for cell cycle up to a certain time period. In the time beyond 10 days, probably no enough space was provided for continuation of proliferation.
Conclusions
Based on our results, we may say that low concentration of SNP as NO releasing agent might be not only safe but also quite helpful. Thus, consumption of SNP might be prescribed for treatment of diseases which require the involvement of bone marrow MSCs, although more investigation is advised.
Authors’ Contribution
The laboratory hand over of the research was carried out by AM. Study concept and design, as well as interpretation of data was developed by MHA. Analysis of data was ran by RP as adviser of the research program.
Conflict of Interest Disclosures
All authors declare that there is no conflict of interests.
Funding/Support
This work was financially supported by Arak University.
Acknowledgments
This project was conducted as a regular MSc research program, and the authorities of Arak University provided us with financial support; therefore the authors wish to thanks their kind cooperation.
References
- Tsoukias N, Popel A. Erythrocyte consumption of nitric oxide in presence and absence of plasma-based hemoglobin. Am J Physiol Heart Circ Physiol 2002;282:2265-77.
- Fedorov R, Vasan R, Ghosh D, Schlichting I. Structures of nitric oxide synthase isoforms complexed with the inhibitor AR-R17477 suggest a rational basis for specificity and inhibitor design. PANS 2004;101(16):5892-7.
- Kelm M. Nitric oxide metabolism and breakdown. Biochim Biophys Acta 1999;1411:273-89.
- Napoli C, Paolisso G, Casamassimi A, Al-Omran M, Barbieri M, Sommese L, et al. Effects of nitric oxide on cell proliferation: novel insights. J Am Coll Cardiol 2013;62(2):89-95. doi:10.1016/j.jacc.2013.03.070. [Crossref]
- Calabrese V, Cornelius C, Rizzarelli E, Owen J, Dinkova-Kostova A, Butterfield D. Nitric oxide in cell survival: a janus molecule. Antioxid Redox Signal 2009;11(11):2717-39. doi: 10.1089/ARS.2009.2721. [Crossref]
- Oyadomari S, Takeda K, Takiguchi M, Gotoh T, Matsumoto M, Wada I, et al. Nitric oxide-induced apoptosis in pancreatic b cells is mediated by the endoplasmic reticulum stress pathway. PNAS 2001;98(19):1845-50.
- Wallace J. Nitric oxide as a regulator of inflammatory processes. Mem Inst Oswaldo Cruz 2005;100(supp1 1):5-9. doi:10.1590/S0074-02762005000900002. [Crossref]
- Spallotta F, Rosati J, Straino S, Nanni S, Grasselli A, Ambrosino V, et al. Nitric oxide determines mesodermic differentiation of mouse embryonic stem cells by activating class IIa histone deacetylases: potential therapeutic implications in a mouse model of hindlimb ischemia. Stem Cells 2010;28(3):431-42. doi:10.1002/stem.300. [Crossref]
- Hanafy K, Krumenacker J, Murad F. NO, nitrotyrosine, and cyclic GMP in signal transduction. Med Sci Monit 2001;7(4):801-19.
- Lockwood A, Patka J, Rabinovich M, Wyatt K, Abraham P. Sodium nitroprusside-associated cyanide toxicity in adult patients – fact or fiction? A critical review of the evidence and clinical relevance. Open Access J Clin Trials 2010;2:133-48.
- Friederich J, Butterworth J. Sodium nitroprusside: twenty years and counting. Anesth Analg 1995;81:152-62.
- Hottinger D, Beebe D, Kozhimannil T, Prielipp R, Belani K. Sodium nitroprusside in 2014: A clinical concepts review. J Anaesth Clin Pharmacol 2014;30(4):462-71. doi:10.4103/0970-9185.142799. [Crossref]
- Lee S, Choi H, Yang Y, Jeong G, Hwang J, Lee S, et al. Nitric oxide modulates osteoblastic differentiation with heme oxygenase-1 via the mitogen activated protein kinase and nuclear factor-kappaB pathways in human periodontal ligament cells. Biol Pharm Bull 2009;32(8):1328-34.
- Hikijia H, Shin Wb, Oida S, Takato T, Koizumi T, Toyo-oka T. Direct action of nitric oxide on osteoblastic differentiation. FEBS Lett 1997;410:238-42.
- Mancini L, Moradi-Bidhendi N, Becherini L, Martineti V, MacIntyre I. The biphasic effects of nitric oxide in primary rat osteoblasts are cGMP dependent. Biochem Biophy Res Commun 2000;274(2):477-81. doi:10.1006/bbrc.2000.3164. [Crossref]
- Saura M, Tarin C, Zaragoza C. Recent Insights into the Implication of Nitric Oxide in Osteoblast Differentiation and Proliferation during Bone Development. ScientificWorldJournal 2010;10:624-32. doi: 10.1100/tsw.2010.58. [Crossref]
- Chen R, Liu H, Lin Y, Jean W, Chen J, Wang J. Nitric oxide induces osteoblast apoptosis through the de novo synthesis of Bax protein. J Orthop Res 2002;30:295-302.
- Chen R, Chen T, Chiu W, Chang C. Molecular mechanism of nitric oxide-induced osteoblast apoptosis. J Orthop Res 2005;23:462-8.
- Ho W, Chen T, Chiu W, Tai Y, Chen R. Nitric oxide induces osteoblast apoptosis through a mitochondria-dependent pathway. Ann NY Acad Sci 2005;1042:460-70.
- Felka T, Ulrich C, Rolauffs B, Mittag F, Kluba T, DeZwart P, et al. Nitric oxide activates signaling by c-Raf, MEK, p-JNK, p38 MAPK and p53 in human mesenchymal stromal cells and inhibits their osteogenic differentiation by blocking expression of Runx2. J Stem Cell Res Ther 2014;4(4):1-9. doi:10.4172/2157-7633.1000195. [Crossref]
- Lee J, Lee S, Choi S, Kim S, Kim W, Jung J. p38 MAP kinase and ERK play an important role in nitric oxide-induced apoptosis of the mouse embryonic stem cells. Toxicol in Vitro 2013;27:492-8. doi:10.1016/j.tiv.2012.07.007. [Crossref]
- Lee Y, Hong C, Lin Y, Chen R. MicroRNA-1 participates in nitric oxide-induced apoptotic insults to MC3T3-E1 cells by targeting heat-shock protein-70. Int J Biol Sci 2015;11(3):246-55. doi:10.7150/ijbs.11138. [Crossref]
- Williams A, Hare J. Mesenchymal stem cells biology, pathophysiology, translational findings, and therapeutic implications for cardiac disease. Circ Res 2011;109:924-40.
- Chu L, Jiang Y, Hao H, Xia H, Xu J, Liu Z, et al. Nitric oxide enhances Oct-4 expression in bone marrow stem cells and promotes endothelial differentiation. Eur J Pharmacol 2008;591:59-65.
- Sass N, Itamoto C, Silva M, Torloni M, Atallah A. Does sodium nitroprusside kill babies? A systematic review. Sao Paulo Med J 2007;125(2):108-11.
- Antosova M, Plevkova J, Strapkova A, Buday T. Nitric oxide—Important messenger in human body. Open J Mol Integr Physiol 2012;2:98-106.
- Pervin S, Singh R, Hernandez E, Wu G, Chaudhuri G. Nitric oxide in physiologic concentrations targets the translational machinery to increase the proliferation of human breast cancer cells: involvement of mammalian target of rapamycin/eIF4E pathway. Cancer Res 2007;67:289-99. doi:10.1158/0008-5472.CAN-05-4623. [Crossref]
- Tran S, Puhar A, Ngo-Camus M, Ramarao N. Trypan blue dye enters viable cells incubated with the pore-forming toxin HlyII of Bacillus cereus. PLoS One 2011;6(9):e22876. doi: 10.1371/journal.pone.0022876. [Crossref]
- Berridge M, Herst P, Tan A. Tetrazolium dyes as tools in cell biology: new insights into their cellular reduction. Biotechnol Annu Rev 2005;11:127-52.
- Chitemerere T, Mukanganyama S. Evaluation of cell membrane integrity as a potential antimicrobial target for plant products. BMC Complement Altern Med 2014;14:278. doi: 10.1186/1472-6882-14-278. [Crossref]
- Haylett D, Jenkinson D. effects of noradrenaline on potassium efflux, membrane potential and electrolyte levels in tissue slices prepared from guinea-pig liver. J Physiol 1972;225:721-50.
- Rich P. The molecular machinery of Keilin’s respiratory chain. Biochem Soc Trans 2003;31(6):1095-105.
- Takada Y, Noguchi T. Characteristics of alanine: glyoxylate aminotransferase from Saccharomyces cerevisiae, a regulatory enzyme in the glyoxylate pathway of glycine and serine biosynthesis from tricarboxylic acidcycle intermediates. Biochem J 1985;231:157-63.