Avicenna Journal of Medical Biochemistry. 10(2):101-107.
doi: 10.34172/ajmb.2022.2321
Original Article
Cardiovascular Property of Resistance Training With an Emphasis on PI3K/AKT1 Genes Expression in Type 2 Diabetic Rats
Mohammad Dastyar 1  , Mojtaba Eizadi 2, * , Mania Roozbayani 1
Author information:
1Department of Exercise Physiology, Borujerd Branch, Islamic Azad University, Borujerd, Iran
2Department of Exercise Physiology, Saveh Branch, Islamic Azad University, Saveh, Iran
Abstract
Background: The potential role of exercise in physiological cardiac hypertrophy is rooted in both hormonal and genetic components.
Objectives: The aim of this study was to determine the impact of resistance exercise on the expression of PI3K and AKT1 in cardiac tissue of type 2 diabetes (T2D) rats and their physiological cardiac hypertrophy.
Methods: First, 21 male Wistar rats (220±20 g) were obese with 6-week high-fat diet (HFD) and were randomly assigned into non-diabetes, control T2D, and exercise diabetes groups. After inducing obesity, T2D was induced by intraperitoneal injection of streptozotocin (25 mg/kg) for diabetes groups. Rats in the exercise group completed a 6-week resistance exercise program, 5 sessions per week. PI3K/AKT1 expression and the weight ratio of left ventricular to heart, heart to body, and left ventricular to body were compared by analysis of variance (ANOVA) between groups.
Results: In response to the induction of diabetes, the expression of PI3K/AKT1 in heart tissue decreased significantly compared to that of non-diabetic rats (P=0.001 and P=0.001, respectively). Further, resistance training led to a significant increase in PI3K expression (P=0.028) and AKT1 (P=0.032) and the weight ratio of left ventricular to heart (P=0.001), heart to the body (P=0.001), and left ventricular to the body (P=0.001) compared to control diabetic rats.
Conclusion: Resistance training is associated with physiological cardiac hypertrophy in diabetic rats, and this improvement may be attributed to the PI3K/AKT1 signaling pathway.
Keywords: Physiological cardiac hypertrophy, Resistance exercise, Gene expression, Diabetes,
Copyright and License Information
© 2022 The Author(s); Published by Hamadan University of Medical Sciences.
This is an open-access article distributed under the terms of the Creative Commons Attribution License (
http://creativecommons.org/licenses/by/4.0), which permits unrestricted use, distribution, and reproduction in any medium provided the original work is properly cited.
Please cite this article as follows: Dastyar M, Eizadi M, Roozbayani M. Cardiovascular property of resistance training with an emphasis on PI3K/AKT1 genes expression in type 2 diabetic rats. Avicenna J Med Biochem. 2022; 10(2):101-107. doi:10.34172/ajmb.2022.2321
Background
Type 2 diabetes (T2D) as the most common metabolic disorder (1) occurs in response to obesity, abnormal diet, and disorders of hormonal and metabolic components, and the role of genetic components in the incidence of this disease has been repeatedly reported in the last two decades (2). On the other hand, the complications of this disease are not limited to hyperglycemia or disorders of cardiovascular risk factors, but the function of tissues such as the heart, kidney, liver, and other tissues of the body are severely affected by this disease (3). These disorders are rooted in both hormonal and genetic factors (1,3). Many cardiovascular diseases such as hypertension, coronary artery disease, pathological hypertrophy, and atrophy of the heart or cavities are also outcomes of this disease (4). In this regard, some clinical studies have suggested an inverse relationship between diabetes and left ventricular dysfunction (5,6).
Cardiomyopathy is 4 times more common in diabetics than in non-diabetics. Factors influencing the development of cardiomyopathy include increased blood pressure and increased myocardial muscle mass due to hypertension (7). Visual and clinical symptoms of patients with diabetic cardiomyopathy are similar to those of patients with heart failure due to other causes such as abnormal ventricular systolic phase associated with movement of the walls and a decrease in ventricular diastolic filling rate, indicating left ventricular diastolic dysfunction (8).
Cardiac hypertrophy is the response of the myocardium to a variety of external and intrinsic stimuli that increase biomechanical stress on the heart (9). Pathological cardiac hypertrophy is manifested by the thickening of the ventricular wall, especially the left ventricle. It is associated with increased muscle mass and collagen accumulation within the myocardium due to the response of myocytes to certain defects and heart disease, resulting in cardiac dysfunction (10). This type of hypertrophy often occurs in hypertension patients and valvular heart disease, which is associated with myocyte apoptosis (11)
In contrast, physiological cardiac hypertrophy is more associated with adaptations such as angiogenesis and blood transfusions than with the heart similar to that observed in athletes (12). This type of hypertrophy is visible from the embryonic stage to adulthood, but the effects of exercise on this type of hypertrophy, which occurs in response to hormonal and metabolic changes, have been reported numerous times (13). On the other hand, the role of transcription factors and genetic components in hypertrophic responses to various stimuli has been considered since the early 1990s (14). Although several transcription factors are involved, the role of the PI3K/AKT1/mTORc1 signaling pathway in physiological hypertrophy of the heart is of particular importance (13). In this regard, it has been suggested that the increased MIR221 expression by decreasing AKT1 leads to the inhibition of cardiac hypertrophy, especially the left ventricle. In other words, overexpression of MIR221 reduces myocardial hypertrophy by inhibiting the AKT1/PI3k signaling pathway (15). On the other hand, the increased signaling of the PI3K/AKT1 pathway leads to physiological hypertrophy of the heart. Genetic studies have revealed that AKT1 as a downstream mediator of PI3K manages the hypertrophic process of cardiac myocytes (16). Some researchers have identified the IGF1-dependent PI3K/AKT1 signaling pathway as the most important pathway leading to physiological cardiac hypertrophy. In this context, it has been reported that 60-minute intense swimming leads to an acute increase in AKT1 phosphorylation (17). On the other hand, Moeini et al reported an increase in AKT1 expression in the heart tissue of diabetic rats in response to the interval (18). However, no study has tracked the response of protein levels or PI3K expression in the cardiac tissue of diabetic rats to exercise. Therefore, due to the lack of study in this field, especially resistance training, this study was performed to assess the impact of resistance training on AKT1 and PI3K expression in cardiac tissue as well as measuring physiological factors of cardiac hypertrophy in rats with T2D.
Materials and Methods
In this experimental study, the study population consisted of male Wistar rats from Baqiyatallah University of Medical Sciences, Tehran, Iran, among which 21 rats aged 10-week old, weighing 220 ± 30 g, were purchased. First, all rats were obese by a 6-week high-fat diet (HFD). After the induction of obesity, T2D was induced by intraperitoneal streptozotocin injection in 14 rats. Then, the studied rats were divided into 3 groups: non-diabetes, control T2D, and exercise T2D. The rats were maintained under standardized conditions and subjected to a 12-hour light/dark cycle at 25 ± 2°C with a humidity of 45-55%.
Induction of Obesity and T2D
After getting acquainted with the laboratory environment, all rats became obese by a 6-week HFD (19), then 7 rats were selected as a non-diabetes obese group (health group, n = 7), and the rest became diabetics. Lee index was used to diagnose obesity (20). T2D was induced by intraperitoneal injection of 25 mg/kg streptozotocin dissolved in citrate buffer at pH 4.5 (19). Diabetic rats were randomly divided into control (n = 7) or exercise (resistance training, n = 7) groups. T2D was confirmed by elevated glucose 1 week after injection, and animals with fasting glucose between 150-400 mg/dL were selected as studied rats (21,22). HFD continued for all groups until the end of the study.
Resistance Training Protocol
After ensuring diabetes induction, all rats in the exercise group climbed on a 26-step ladder with a slope of 80% without resistance for 3 sessions (6 times) to learn how to exercise. Then, they completed a resistance exercise that lasted for 6 weeks (5 sessions per week). The animals climbed and descended the ladder 3 times without resistance before and after the workout in order to warm up and cool down.
Each session of exercise training involved 5 courses with 4 repetitions on each course, and the resistance was increased by attaching weights to the mouse tail. Breaks between courses and repetitions were 3 minutes and 45 seconds, respectively. According to Table 1, the resistance increased gradually during the training program (19). Finally, all rats were dissected 48 hours after the last exercise session following an overnight fast, and the non-diabetes and diabetes control rats did not participate in the exercise program.
Table 1.
Resistance Training Protocol Based on Body Weight Percentage
|
Time
|
Week 1
|
Week 2
|
Week 3
|
Week 4
|
Weeks 5 and 6
|
Resistance
(body weight %) |
30 |
50 |
70 |
90 |
100 |
Blood Sampling and Tissue Extraction
Forty-eight hours after the last exercise session following an overnight fast, all rats were anesthetized by intraperitoneal injection of 10% ketamine (50 mg/kg), along with 2% xylazine (10 mg/kg), and then they underwent dissection (23). Afterward, blood samples were collected through heart puncture. Then, heart tissue was removed, the left ventricular was dissected and immersed in RNA later to determine PI3K and AKT1 expression, and insulin was assessed by ELISA (Germany, Demeditec). The intra- and inter-assay coefficients for insulin were 2.6% and 2.88%, respectively. Glucose was assessed by glucose oxidase (Pars Azmoon kit, Tehran), and homeostatic model assessment for insulin resistance (HOMA-IR) was calculated by fasting glucose (mg/dL) × insulin (uIU/mL) / 405 (24).
RNA Extraction /Real Time-Polymerase Chain Reaction
To purify RNA, 20 mg of tissue were ground using a mortar and pestle, and extraction was then performed employing the RNeasy Protect Mini Kit (Qiagen Inc, Germany) according to the manufacturer’s protocol (19). In this stage, the one-step SYBR Prime Script RT-PCR Kit (Takara Bio Inc, Japan) was employed according to the manufacturer’s protocol to prepare the reaction product. Thermal cycle programs used for the Rotor-Gene Q instrument were 42˚C for 20 minutes, 95˚C for 2 minutes, 40 cycles with 94˚C for 10 seconds, and 60˚C for 40 seconds. Temperatures between 50˚C-99˚C were used for the melting curve after polymerase chain reaction to study the characteristics of the primers; further, RNA polymerase II was used as a control gene (Table 2).
Table 2.
Genes Primer Sequence
|
Genes
|
Primer Sequence
|
| PI3K |
For: ACTGAGATGGAGACACGGAAC
Rev: GCATCCAAGGGTCCAGTTAGTG |
| AKT1 |
For: AGGAGGTCATCGTTGCCAAG
Rev: GCTCACGAGACAGGTGGAAG |
| RNA Polymerase ΙΙ |
For: ACTTTGATGACGTGGAGGAGGAC
Rev: GTTGGCCTGCGGTCGTTC |
Statistical Analysis
Data were analyzed by Statistical Package for the Social Sciences (SPSS) for Windows version 22.0 and were expressed as mean ± standard deviation. One-way analysis of variance (ANOVA) and Tukey post hoc tests were used to compare the variables between groups. Differences of less than 5% were considered significant.
Results
Patterns of body weight changes of the groups before and after exercise training are presented in Table 3.
Table 3.
Body Weight at Pre- and Post-intervention of Studied Groups
|
Group
|
Pre-intervention
|
Post-intervention
|
Sig. (Paired Test)
|
| Non-diabetes |
304 ± 9 |
401 ± 13 |
0.001 |
| Control diabetes |
306 ± 10 |
387 ± 9 |
0.001 |
| Resistance diabetes |
308 ± 11 |
415 ± 6 |
0.001 |
| Sig. (ANOVA) |
0.831 |
0.001 |
- |
Note. Sig: Significance; ANOVA: Analysis of variance.
The results of the one-way ANOVA test revealed that no difference was found in body weight between the three groups before exercise intervention (P = 0.831). On the other hand, the findings indicated a significant difference in weight after exercise intervention (P = 0.001). Based on the Tukey test, no difference was observed in body weight between the non-diabetic and control diabetes groups (P = 0.062). On the other hand, body weight in the resistance diabetic group was significantly higher than that in the other groups (non-diabetic: P = 0.042, control diabetes: P = 0.001). Moreover, the biochemical markers of the studied group are reported in Table 4.
Table 4.
Mean and SD of Body Weight and Diabetes Determinants of Studied Groups
|
Group
|
Non-diabetes
|
Control Diabetes
|
Resistance Diabetes
|
Sig. (ANOVA)
|
| Glucose (mg/ dL) |
122 ± 5 |
300 ± 12 |
189 ± 17 |
0.001 |
| Insulin (µIU/mL) |
9.23 ± 0.64 |
5.97 ± 0.22 |
6.58 ± 0.15 |
0.001 |
| Insulin resistance (HOMA-IR) |
2.77 ± 0.21 |
4.42 ± 0.24 |
3.08 ± 0.30 |
0.001 |
| Heart weight (g) |
1.147 ± 0.501 |
1.033 ± 0.0407 |
1.232 ± 0.0115 |
0.001 |
| Left ventricular (g) |
0.4115 ± 0.0434 |
0.3480 ± 0.0120 |
0.5453 ± 0.0140 |
0.001 |
Note. Sig: Significance. ANOVA: Analysis of variance.
The main objective of the present study was to determine the impact of resistance training on PI3K and AKT1 expression in cardiac tissue. The findings revealed that the induction of diabetes in obese rats reduced PI3K and AKT1 expression (Figure 1, Figure 2). In other words, the expression of PI3K and AKT1 in diabetic control was significantly lower than that in non-diabetic groups (P = 0.001, P = 0.001, respectively). In other words, resistance training increased their expression in diabetic rats. In other words, the expression of PI3K and AKT1 in the resistant diabetic group (P = 0.028) increased significantly compared to the control diabetic group (P = 0.032) (Table 5).
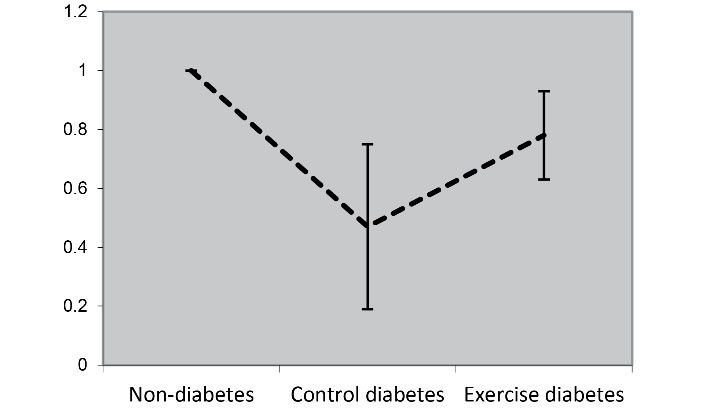
Figure 1.
PI3K Expression in Cardiac Tissue of Studied Groups. T2D induction led to a decrease in PI3K expression compared to the non-diabetic group. Resistance training also increased PI3K expression compared to control rats
.
PI3K Expression in Cardiac Tissue of Studied Groups. T2D induction led to a decrease in PI3K expression compared to the non-diabetic group. Resistance training also increased PI3K expression compared to control rats
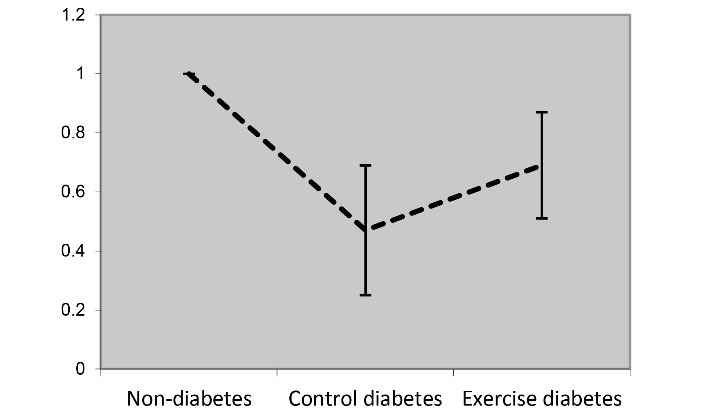
Figure 2.
AKT1 Expression in Cardiac Tissue of Studied Groups. T2D induction led to a decrease in AKT1 expression compared to the non-diabetic group. Resistance training also increased AKT1 expression compared to control rats
.
AKT1 Expression in Cardiac Tissue of Studied Groups. T2D induction led to a decrease in AKT1 expression compared to the non-diabetic group. Resistance training also increased AKT1 expression compared to control rats
Table 5.
Pattern of Changes in Gene Expression in Response to Diabetes Induction and Resistance Training
|
Group
|
Non-diabetes
|
Control Diabetes
|
Resistance Diabetes
|
Sig. (ANOVA)
|
| PI3K relative expression |
1 |
0.47 ± 0.28 |
0.78 ± 0.15 |
0.001 |
| AKT1 relative expression |
1 |
0.47 ± 0.22 |
0.69 ± 0.18 |
0.001 |
Note. ANOVA: Analysis of variance.
Another objective of the present study was to determine the cardiovascular effects of resistance training, which was tested by comparing the ratios of left ventricular/heart weight, left ventricular/body weight, and heart/body weight. For this purpose, these ratios were compared by one-way ANOVA test between the studied groups and Tukey post hoc test. The findings revealed that the induction of T2D in obese rats reduced these ratios. In other words, the ratios of left ventricular/heart weight, left ventricular/body weight, and heart/body weight decreased significantly in the diabetic control compared to non-diabetic group (P = 0.039, P = 0.035, P = 0.010, respectively). On the other hand, resistance training increased these ratios in diabetic rats. In other words, the ratios of left ventricular/heart weight, left ventricular/body weight, and heart/body weight in the resistance diabetic group increased significantly compared to the control diabetic group (P = 0.001, P= 0.001, P = 0.001, respectively) (Table 6).
Table 6.
Mean and SD of Determinant Markers of Physiological Cardiac Hypertrophy of Studied Groups
|
Group
|
Non-diabetes
|
Control Diabetes
|
Resistance Diabetes
|
Sig. (ANOVA)
|
| Left ventricular/heart ratio |
0.3605 ± 0.0517 |
0.3375 ± 0.0195 |
0.4427 ± 0.0114 |
0.001 |
| Left ventricular/body ratio |
0.00103 ± 0.00014 |
0.00090 ± 0.000033 |
0.00131 ± 000030 |
0.001 |
| Heart/body ratio |
0.00286 ± 0.00011 |
0.00267 ± 0.00011 |
0.00297 ± 0.00005 |
0.001 |
Note. Sig: Significance. ANOVA: Analysis of variance.
Discussion
The results of the present study pointed to the cardiovascular effects of resistance training with an emphasis on improving the PI3K/AKT1 signaling pathway in the hearts of diabetic rats. This study found an increased expression of PI3K and AKT1 in cardiac tissue in response to resistance training in diabetic rats. Although T2D inductions led to the decreased expression of PI3K/AKT1 in obese rats, 6 weeks of resistance training for 5 sessions per week is associated with increased expression of these transcription factors. The cardiovascular effects of resistance training in the present study can also be observed by increasing the ratios of left ventricular/heart weight, left ventricular/body weight, and heart/body weight in response to this training method. In this regard, however, there were no studies that directly assess the effect of exercise on the PI3K/AKT1 axis in the hearts of diabetic rats. However, Moeini et al reported an increase in AKT1 expression in cardiac tissue of diabetic rats in response to interval training (18). On the other hand, in the study by Mirsepasi et al, 12 weeks of interval exercise resulted in an increased AKT1 and mTORc1 expression in the left ventricle of T2D rats (25). In contrast, some human and animal studies have not reported any effect of acute exercise on insulin-dependent signal changes such as changes in insulin receptor substrate phosphorylation or PI3K activity (26,27). However, it has been noted that acute continuous endurance exercise for 45 to 60 minutes with 65% to 75% VO₂ max leads to an increase in PI3K activity in the muscles of healthy people and also in people with insulin resistance (28,29).
The IGF1-PI3K-Akt axis is recognized as one of the most important signaling pathways responsible for exercise-induced physiological cardiac hypertrophy. Activation of this signaling pathway has been found to help inhibit cardiovascular tissue damage in mice with heart damage and cardiovascular disease with physiological hypertrophy of the heart, while reducing the activity of this pathway with destructive effects on heart function and accelerating disease progression. It is associated with a predisposition to pathological hypertrophy of the heart (13). Cellular-molecular studies have revealed that metabolic and hormonal disorders such as decreased diabetes-dependent insulin due to decreased expression of PI3K and AKT1or reduced PI3K/AKT1 signaling activity in cardiac myocytes reduce or inhibit physiological hypertrophy of the heart (30,31). Of course, this process is intensified by reducing mTORc1 expression (32). In contrast, increased activity or improvement of the PI3K/AKT1/mTORc1 signaling pathway in response to internal or external stimuli leads to protein synthesis or physiological hypertrophy of the heart (32). The p11α isoform of PI3K has been introduced as a critical regulator of exercise-dependent hypertrophy, postnatal cardiac growth, and exercise-induced heart protection (13). PI3K (p110α) activity has been reported to increase in rat hearts approximately 2 weeks after swimming or running on a treadmill (33). Along with increasing circulating IGF-1 levels (34), exercise also increases PI3K (p110α) activity in humans and animal species (35). PI3K (p110α) catalyzes the phosphorylation of lipids in plasma membranes to produce second messengers such as phosphatidylinositol 3,4,5-trisphosphate (36).
Genetic studies have revealed that among the AKT isoforms (AKT1, AKT2, AKT3), AKT1 which is one of the target genes of PI3K (37) is the main isoform of the AKT family in the regulation of physiological cardiac hypertrophy by exercise (38). In fact, AKT1 is stimulated by several tyrosine kinase receptors such as PI3K. Inositol PI3K phosphorylates the lipids that directly activate AKT1 and transport AKT1 to the cell plasma membrane (39). On the other hand, AKT1 activity is also regulated by factors such as insulin, nutritional status, and exercise. Increasing insulin levels in heart tissue in response to exercise leads to increased AKT1 activity through insulin-dependent or non-insulin-dependent pathways (39).
Despite the evidence, Kazior et al noted that although resistance training alone did not alter AKT1 expression in skeletal muscle, combination training (resistance + aerobics) was associated with increased AKT1 expression associated with muscle hypertrophy (40). In the study by de Souza et al, combined training (resistance + aerobics) increased the expression of AKT1 protein in skeletal muscle (87%), while resistance training alone was not associated with any change (41). The difference between the present study and the above-mentioned studies, which pointed to the lack of response of AKT1 to resistance training, can be attributed to the type of tissue as well as the type of population under study. For example, the above-mentioned studies measured changes in expression or protein levels in the skeletal muscle of non-diabetics, while the present study measured these changes in the heart tissue of T2D rats.
Therefore, considering the atrophic and catabolic effects of diabetes on the heart muscle, cardiac hypertrophy and increased PI3K and AKT1 expression in response to resistance training may be attributed to the baseline levels of these variables compared to the non-diabetic group. Further, a comparison of variables between groups revealed that PI3K/AKT1 expression and the ratios of left ventricular/heart weight, left ventricular/body weight, and heart/body weight in the control diabetic group were significantly lower than those in the non-diabetic group. In this regard, Falcão-Pires et al also cited that insulin resistance in diabetics leads to disruption of the PI3K/AKT1 signaling pathway (42). On the other hand, it was also reported that increased activity of other signaling pathways results in hypertrophy such as the PI3K/P110α pathway in the hearts of rats in response to exercise (43). In this regard, researchers believe that targeting the cardiac IGF1/PI3K pathway and other related signaling pathways is a potential therapeutic strategy for the treatment of cardiac patients (44).
Conclusion
Resistance training is associated with physiological cardiac hypertrophy in T2D rats. This training method increases the ratios of the left ventricular/heart weight, left ventricular/body weight, and heart/body weight in obese diabetic rats. Based on the findings of the current study and previous evidence, this improvement can be attributed to the increased activity of the PI3K/AKT1 axis in response to this training method. Understanding other mechanisms responsible for physiological cardiac hypertrophy requires further studies in this area.
Acknowledgments
The authors thank the Islamic Azad University of Borujerd Branch for supporting this study.
Author Contributions
Data curation: Mohammad Dastyar, Mojtaba Eizadi, Mania Roozbayani.
Formal Analysis: Mojtaba Eizadi.
Investigation: Mohammad Dastyar, Mojtaba Eizadi, Mania Roozbayani.
Methodology: Mohammad Dastyar, Mojtaba Eizadi, Mania Roozbayani.
Project administration: Mohammad Dastyar, Mojtaba Eizadi, Mania Roozbayani.
Software: Mojtaba Eizadi.
Supervision: Mojtaba Eizadi.
Writing – original draft: Mohammad Dastyar, Mojtaba Eizadi, Mania Roozbayani.
Writing – review & editing: Mohammad Dastyar, Mojtaba Eizadi, Mania Roozbayani.
Conflict of Interests
The authors of the study have no conflict of interests.
Ethical Issues
The study was approved by the Ethics Committee Research of the Islamic Azad University, Borujerd Branch, Iran (Code of Ethics: IR.IAU.B.REC.1400.014) and carried out according to the Ethics Committee for Laboratory Animal Research.
Funding/Support
This study was supported by the Islamic Azad University, Borujerd Branch, Iran.
References
- Diniz TA, Antunes BM, Little JP, Lira FS, Rosa-Neto JC. Exercise training protocols to improve obesity, glucose homeostasis, and subclinical inflammation. Methods Mol Biol 2022; 2343:119-45. doi: 10.1007/978-1-0716-1558-4_7 [Crossref] [ Google Scholar]
- Alibegovic AC, Sonne MP, Højbjerre L, Hansen T, Pedersen O, van Hall G. The T-allele of TCF7L2 rs7903146 associates with a reduced compensation of insulin secretion for insulin resistance induced by 9 days of bed rest. Diabetes 2010; 59(4):836-43. doi: 10.2337/db09-0918 [Crossref] [ Google Scholar]
- Aras M, Tchang BG, Pape J. Obesity and Diabetes. Nurs Clin North Am 2021; 56(4):527-41. doi: 10.1016/j.cnur.2021.07.008 [Crossref] [ Google Scholar]
- De Luca A, Stefani L, Pedrizzetti G, Pedri S, Galanti G. The effect of exercise training on left ventricular function in young elite athletes. Cardiovasc Ultrasound 2011; 9:27. doi: 10.1186/1476-7120-9-27 [Crossref] [ Google Scholar]
- Barauna VG, Rosa KT, Irigoyen MC, de Oliveira EM. Effects of resistance training on ventricular function and hypertrophy in a rat model. Clin Med Res 2007; 5(2):114-20. doi: 10.3121/cmr.2007.707 [Crossref] [ Google Scholar]
- Bradley TJ, Slorach C, Mahmud FH, Dunger DB, Deanfield J, Deda L. Early changes in cardiovascular structure and function in adolescents with type 1 diabetes. Cardiovasc Diabetol 2016; 15:31. doi: 10.1186/s12933-016-0351-3 [Crossref] [ Google Scholar]
- Soufi FG, Saber MM, Ghiassie R, Alipour M. Role of 12-week resistance training in preserving the heart against ischemia-reperfusion-induced injury. Cardiol J 2011; 18(2):140-5. [ Google Scholar]
- Melzer D, Murray A, Hurst AJ, Weedon MN, Bandinelli S, Corsi AM. Effects of the diabetes linked TCF7L2 polymorphism in a representative older population. BMC Med 2006; 4:34. doi: 10.1186/1741-7015-4-34 [Crossref] [ Google Scholar]
- Buss SJ, Riffel JH, Malekar P, Hagenmueller M, Asel C, Zhang M. Chronic Akt blockade aggravates pathological hypertrophy and inhibits physiological hypertrophy. Am J Physiol Heart Circ Physiol 2012; 302(2):H420-30. doi: 10.1152/ajpheart.00211.2011 [Crossref] [ Google Scholar]
- Dillmann W. Cardiac hypertrophy and thyroid hormone signaling. Heart Fail Rev 2010; 15(2):125-32. doi: 10.1007/s10741-008-9125-7 [Crossref] [ Google Scholar]
- DeBosch B, Treskov I, Lupu TS, Weinheimer C, Kovacs A, Courtois M. Akt1 is required for physiological cardiac growth. Circulation 2006; 113(17):2097-104. doi: 10.1161/circulationaha.105.595231 [Crossref] [ Google Scholar]
- Walsh K. Akt signaling and growth of the heart. Circulation 2006; 113(17):2032-4. doi: 10.1161/circulationaha.106.615138 [Crossref] [ Google Scholar]
- Weeks KL, Bernardo BC, Ooi JYY, Patterson NL, McMullen JR. The IGF1-PI3K-Akt signaling pathway in mediating exercise-induced cardiac hypertrophy and protection. Adv Exp Med Biol 2017; 1000:187-210. doi: 10.1007/978-981-10-4304-8_12 [Crossref] [ Google Scholar]
- Akhter SA, Luttrell LM, Rockman HA, Iaccarino G, Lefkowitz RJ, Koch WJ. Targeting the receptor-Gq interface to inhibit in vivo pressure overload myocardial hypertrophy. Science 1998; 280(5363):574-7. doi: 10.1126/science.280.5363.574 [Crossref] [ Google Scholar]
- Su M, Wang J, Wang C, Wang X, Dong W, Qiu W. MicroRNA-221 inhibits autophagy and promotes heart failure by modulating the p27/CDK2/mTOR axis. Cell Death Differ 2021; 28(1):420-2. doi: 10.1038/s41418-020-0582-4 [Crossref] [ Google Scholar]
- Li JM, Brooks G. Downregulation of cyclin-dependent kinase inhibitors p21 and p27 in pressure-overload hypertrophy. Am J Physiol 1997; 273(3 Pt 2):H1358-67. doi: 10.1152/ajpheart.1997.273.3.H1358 [Crossref] [ Google Scholar]
- Castorena CM, Arias EB, Sharma N, Cartee GD. Postexercise improvement in insulin-stimulated glucose uptake occurs concomitant with greater AS160 phosphorylation in muscle from normal and insulin-resistant rats. Diabetes 2014; 63(7):2297-308. doi: 10.2337/db13-1686 [Crossref] [ Google Scholar]
- Moeini M, Behpoor N, Tadibi V. The effect of high-intensity interval training on the expression of protein kinase B (Akt gene) in the left ventricle of male rats with type 2 diabetes. J Jiroft Univ Med Sci 2020;7(2):332-40. [Persian].
- Yazdanpazhooh S, Banaeifar A, Arshadi S, Eizadi M. Six weeks resistance training effect on FTO expression in type II diabetes rats. Iran J Diabetes Obes 2018; 10(4):216-22. [ Google Scholar]
- Novelli EL, Diniz YS, Galhardi CM, Ebaid GM, Rodrigues HG, Mani F. Anthropometrical parameters and markers of obesity in rats. Lab Anim 2007; 41(1):111-9. doi: 10.1258/002367707779399518 [Crossref] [ Google Scholar]
- Daryanoosh F, Tanideh N, Bazgir B, Alizadeh H. Effect of aerobic trainings on heart’s functioned and structure in diabetic Sprague-Dawely albino species male rats. J Appl Exerc Physiol 2010;6(12):59-72. [Persian].
- Eizadi M, Ravasi AA, Soory R, Baesi K, Choobineh S. The effect of three months of resistance training on TCF7L2 expression in pancreas tissues of type 2 diabetic rats. Avicenna J Med Biochem 2016; 4(1):12-34014. doi: 10.17795/ajmb-34014 [Crossref] [ Google Scholar]
- Eizadi M, Soory R, Ravasi A, Baesy K, Choobineh S. Relationship between TCF7L2 relative expression in pancreas tissue with changes in insulin by high intensity interval training (HIIT) in type 2 diabetes rats. J Shahid Sadoughi Univ Med Sci 2017;24(12):981-93. [Persian].
- McAuley KA, Williams SM, Mann JI, Walker RJ, Lewis-Barned NJ, Temple LA. Diagnosing insulin resistance in the general population. Diabetes Care 2001; 24(3):460-4. doi: 10.2337/diacare.24.3.460 [Crossref] [ Google Scholar]
- Mirsepasi M, Baneifar AA, Azarbayjani MA, Arshadi S. The effects of high intensity interval training on gene expression of AKT1 and mTORc1 in the left ventricle of type 2 diabetic rats: an experimental study. J Rafsanjan Univ Med Sci 2019;17(12):1119-30. [Persian].
- Deshmukh A, Coffey VG, Zhong Z, Chibalin AV, Hawley JA, Zierath JR. Exercise-induced phosphorylation of the novel Akt substrates AS160 and filamin A in human skeletal muscle. Diabetes 2006; 55(6):1776-82. doi: 10.2337/db05-1419 [Crossref] [ Google Scholar]
- Wojtaszewski JF, Hansen BF, Gade Gade, Kiens B, Markuns JF, Goodyear LJ. Insulin signaling and insulin sensitivity after exercise in human skeletal muscle. Diabetes 2000; 49(3):325-31. doi: 10.2337/diabetes.49.3.325 [Crossref] [ Google Scholar]
- Cusi K, Maezono K, Osman A, Pendergrass M, Patti ME, Pratipanawatr T. Insulin resistance differentially affects the PI 3-kinase- and MAP kinase-mediated signaling in human muscle. J Clin Invest 2000; 105(3):311-20. doi: 10.1172/jci7535 [Crossref] [ Google Scholar]
- Howlett KF, Sakamoto K, Yu H, Goodyear LJ, Hargreaves M. Insulin-stimulated insulin receptor substrate-2-associated phosphatidylinositol 3-kinase activity is enhanced in human skeletal muscle after exercise. Metabolism 2006; 55(8):1046-52. doi: 10.1016/j.metabol.2006.03.016 [Crossref] [ Google Scholar]
- Jiang ZY, Lin YW, Clemont A, Feener EP, Hein KD, Igarashi M. Characterization of selective resistance to insulin signaling in the vasculature of obese Zucker (fa/fa) rats. J Clin Invest 1999; 104(4):447-57. doi: 10.1172/jci5971 [Crossref] [ Google Scholar]
- De Nigris V, Pujadas G, La Sala L, Testa R, Genovese S, Ceriello A. Short-term high glucose exposure impairs insulin signaling in endothelial cells. Cardiovasc Diabetol 2015; 14:114. doi: 10.1186/s12933-015-0278-0 [Crossref] [ Google Scholar]
- Ahmadiasl N, Najafipour H, Ghadiri Soufi F, Jafari A. Effect of short- and long-term strength exercise on cardiac oxidative stress and performance in rat. J Physiol Biochem 2012; 68(1):121-8. doi: 10.1007/s13105-011-0125-z [Crossref] [ Google Scholar]
- Perrino C, Naga Prasad SV, Mao L, Noma T, Yan Z, Kim HS. Intermittent pressure overload triggers hypertrophy-independent cardiac dysfunction and vascular rarefaction. J Clin Invest 2006; 116(6):1547-60. doi: 10.1172/jci25397 [Crossref] [ Google Scholar]
- Kodama Y, Umemura Y, Nagasawa S, Beamer WG, Donahue LR, Rosen CR. Exercise and mechanical loading increase periosteal bone formation and whole bone strength in C57BL/6J mice but not in C3H/Hej mice. Calcif Tissue Int 2000; 66(4):298-306. doi: 10.1007/s002230010060 [Crossref] [ Google Scholar]
- Kessler A, Uphues I, Ouwens DM, Till M, Eckel J. Diversification of cardiac insulin signaling involves the p85 alpha/beta subunits of phosphatidylinositol 3-kinase. Am J Physiol Endocrinol Metab 2001; 280(1):E65-74. doi: 10.1152/ajpendo.2001.280.1.E65 [Crossref] [ Google Scholar]
- Whitman M, Downes CP, Keeler M, Keller T, Cantley L. Type I phosphatidylinositol kinase makes a novel inositol phospholipid, phosphatidylinositol-3-phosphate. Nature 1988; 332(6165):644-6. doi: 10.1038/332644a0 [Crossref] [ Google Scholar]
- Bacurau AV, Jannig PR, de Moraes WM, Cunha TF, Medeiros A, Barberi L. Akt/mTOR pathway contributes to skeletal muscle anti-atrophic effect of aerobic exercise training in heart failure mice. Int J Cardiol 2016; 214:137-47. doi: 10.1016/j.ijcard.2016.03.071 [Crossref] [ Google Scholar]
- Liao J, Li Y, Zeng F, Wu Y. Regulation of mTOR pathway in exercise-induced cardiac hypertrophy. Int J Sports Med 2015; 36(5):343-50. doi: 10.1055/s-0034-1395585 [Crossref] [ Google Scholar]
- Shiojima I, Yefremashvili M, Luo Z, Kureishi Y, Takahashi A, Tao J. Akt signaling mediates postnatal heart growth in response to insulin and nutritional status. J Biol Chem 2002; 277(40):37670-7. doi: 10.1074/jbc.M204572200 [Crossref] [ Google Scholar]
- Kazior Z, Willis SJ, Moberg M, Apró W, Calbet JA, Holmberg HC. Endurance exercise enhances the effect of strength training on muscle fiber size and protein expression of Akt and mTOR. PLoS One 2016; 11(2):e0149082. doi: 10.1371/journal.pone.0149082 [Crossref] [ Google Scholar]
- de Souza EO, Tricoli V, Bueno Junior C, Pereira MG, Brum PC, Oliveira EM. The acute effects of strength, endurance and concurrent exercises on the Akt/mTOR/p70(S6K1) and AMPK signaling pathway responses in rat skeletal muscle. Braz J Med Biol Res 2013; 46(4):343-7. doi: 10.1590/1414-431x20132557 [Crossref] [ Google Scholar]
- Falcão-Pires I, Hamdani N, Borbély A, Gavina C, Schalkwijk CG, van der Velden J. Diabetes mellitus worsens diastolic left ventricular dysfunction in aortic stenosis through altered myocardial structure and cardiomyocyte stiffness. Circulation 2011; 124(10):1151-9. doi: 10.1161/circulationaha.111.025270 [Crossref] [ Google Scholar]
- Perrino C, Schroder JN, Lima B, Villamizar N, Nienaber JJ, Milano CA. Dynamic regulation of phosphoinositide 3-kinase-gamma activity and beta-adrenergic receptor trafficking in end-stage human heart failure. Circulation 2007; 116(22):2571-9. doi: 10.1161/circulationaha.107.706515 [Crossref] [ Google Scholar]
- McMullen JR, Shioi T, Huang WY, Zhang L, Tarnavski O, Bisping E. The insulin-like growth factor 1 receptor induces physiological heart growth via the phosphoinositide 3-kinase(p110alpha) pathway. J Biol Chem 2004; 279(6):4782-93. doi: 10.1074/jbc.M310405200 [Crossref] [ Google Scholar]