Avicenna Journal of Medical Biochemistry. 10(1):46-51.
doi: 10.34172/ajmb.2022.06
Original Article
Hyperuricemia and Associated Cardiometabolic Factors: A Cross-sectional Study on Taxi-motorbike Drivers Working in Cotonou, Benin
Patrice Hodonou Avogbe *  , Ambaliou Sanni
Author information:
Laboratory of Biochemistry and Molecular Biology, Department of Biochemistry and Cellular Biology, Faculty of Science and Techniques, University of Abomey-Calavi, 04 BP 320, Cotonou, Benin
*
Corresponding author: Patrice Hodonou Avogbe, Laboratory of Biochemistry and Molecular Biology, Department of Biochemistry and Cellular Biology, Faculty of Science and Techniques, University of Abomey-Calavi, 04 BP 320, Cotonou, Benin. Tel:+22951507024, Email:
Patrice.avogbe@gmail.com
Abstract
Background: An elevated level of uric acid (UA), also known as hyperuricemia (HUA), contributes to the occurrence of cardiovascular diseases (CVDs). However, epidemiolocal features of HUA in populations of Benin are rare.
Objectives: We identified clinical and metabolic factors associated with HUA in taxi-motorbike drivers (TMDs) of Cotonou.
Methods: A total of 134 participants with a mean age of 39.3 years were analyzed using a retrospective cross-sectional study design. Data from a self-administered questionnaire and biochemical markers including, plasma UA, glucose, insulin, creatinine, and lipids were obtained from each participant. HUA was defined as plasma UA greater than 416 μmol/L. Insulin resistance (IR) was determined using the homeostatic model assessment (HOMA). Logistic regression analysis was performed to determine the association of various risk factors with HUA. Odds ratio (OR) and 95% confidence interval (CI) were calculated for HUA.
Results: The overall prevalence of HUA was 19.4% (95% CI: 12.7-26.1) in TMDs. Multivariable logistic regression showed that IR (OR=3.60, 95% CI: 1.27-10.22, P=0.02), hypertension (OR=2.75, 95% CI: 1.00- 7.54, P=0.05), and triglycerides (TG; OR=4.25, 95% CI: 1.39-12.98, P=0.01) were risk factors for HUA. Furthermore, creatinine was inversely associated with HUA (OR=0.62, 95% CI: 0.41-0.94, P=0.02).
Conclusion: HUA was found in 19.4% of the patients. In addition, hypertension, IR, creatinine, and TG levels were independently associated with HUA in TMDs. Therefore, the monitoring of these markers may help prevent HUA.
Keywords: Cotonou, Hypertension, Hyperuricemia, Insulin resistance, Taxi-motorbike drivers, Uric acid,
Copyright and License Information
© 2022 The Author(s); Published by Hamadan University of Medical Sciences.
This is an open-access article distributed under the terms of the Creative Commons Attribution License (
http://creativecommons.org/licenses/by/4.0), which permits unrestricted use, distribution, and reproduction in any medium provided the original work is properly cited.
Please cite this article as follows: Avogbe PH, Sanni A. Hyperuricemia and associated cardiometabolic factors: a cross-sectional study on taxi-motorbike drivers working in cotonou, benin. Avicenna J Med Biochem. 2022; 10(1):46-51. doi:10.34172/ajmb.2022.06
Background
Uric acid (UA) is the final enzymatic product of purines, which are either normally produced in the body or arise from foods and drinks (1,2). Nucleotidase enzymes act on the phosphate group of adenosine monophosphate and guanine monophosphate to produce inosine and guanosine, respectively. Inosine and guanosine are further converted to hypoxanthine and guanine, respectively. Hypoxanthine is then oxidized to form xanthine by xanthine oxidase, and guanine is deaminated to form xanthine by guanine deaminase. Xanthine oxidoreductase converts xanthine to UA, which is the final product of the catabolism of purine in humans (3,4). In other mammals, uricase converts UA to allantoin (5), which has a more efficient urinary excretion route compared to UA (6).
Under physiological conditions, UA synthesis and excretion are balanced in the body. Abnormalities in this balance may lead to hyperuricemia (HUA). UA levels greater than 416 µmol/L in male or female UA levels > 360 µmol/L are considered as HUA (7). Studies have evidenced that HUA is both a protective and risk factor in human diseases including non-communicable diseases (8). HUA predisposes to gout through the formation of urate crystals (2). Moreover, a growing body of evidence indicates that elevated UA levels, independent of crystal formation, might play a pathophysiological role in many “cardio-nephro-metabolic” disorders (2,9). Several reports have indicated a link between the high UA levels and risk of incident hypertension (3,10). Further, HUA is a risk factor for the development of diabetes (11,12), chronic kidney disease (13,14), as well as the occurrence of cardiovascular events (15-17).
To the best of our knowledge, epidemiolocal features of HUA have never been assessed in Benin populations, including taxi-motorbike drivers (TMDs) working in Cotonou city. TMDs are exposed to well-known cardiovascular risk factors such as ultrafine particles (UFP) (18). Additionally, lifestyle behaviors such as alcohol intake, fat-rich dietary patterns, and lack of exercise due to long working hours induce high cardiovascular risk profiles in TMDs. However, the majority of previous studies on TMDs focused on genotoxic effects of ambient air pollutants, and data on the prevalence of HUA are lacking. As such, it is important to obtain data on HUA to control for non-communicable diseases among TMDs.
This study aimed to determine the prevalence of HUA in the TMDs of Cotonou. We also identified clinical and metabolic factors associated with HUA. We hypothesized that HUA is associated with cardiovascular risk factors (e.g., blood lipids and insulin resistance) and tested this hypothesis in a cross-sectional study.
Materials and Methods
Study Design and Population
The air pollution survey (APS) investigated the health effects of air pollution on exposed populations of Cotonou including TMDs. Data were collected during physical check-ups by a trained physician after informed consent was obtained from the participants. All survey participants were male and non-smokers with no history of diabetes or cardiovascular diseases (CVDs). Each participant provided blood samples for analysis of biochemical and genotoxic markers. Detailed information on the study participants has been previously described (18,19).
In the APS, TMDs were offered regular health checkups. Therefore, we conducted a retrospective cross-sectional study utilizing existing data to identify some clinical and metabolic factors associated with HUA. In this study, we analyzed data related to TMDs included in the APS between April and July 2009. Participants could be included in the study if they were over 18 years old and had measurements of plasma UA, glucose, insulin, creatinine, and lipids. Furthermore, as patients with HUA had an increased risk of having type 2 diabetes (T2D), those with a fasting blood glucose ≥ 7.0 mmol/L were excluded. Out of 147 TMDs initially included, 134 met inclusion criteria and were, therefore, analyzed in this study (Figure 1). The APS protocol was evaluated and approved by the Benin Environmental Agency.
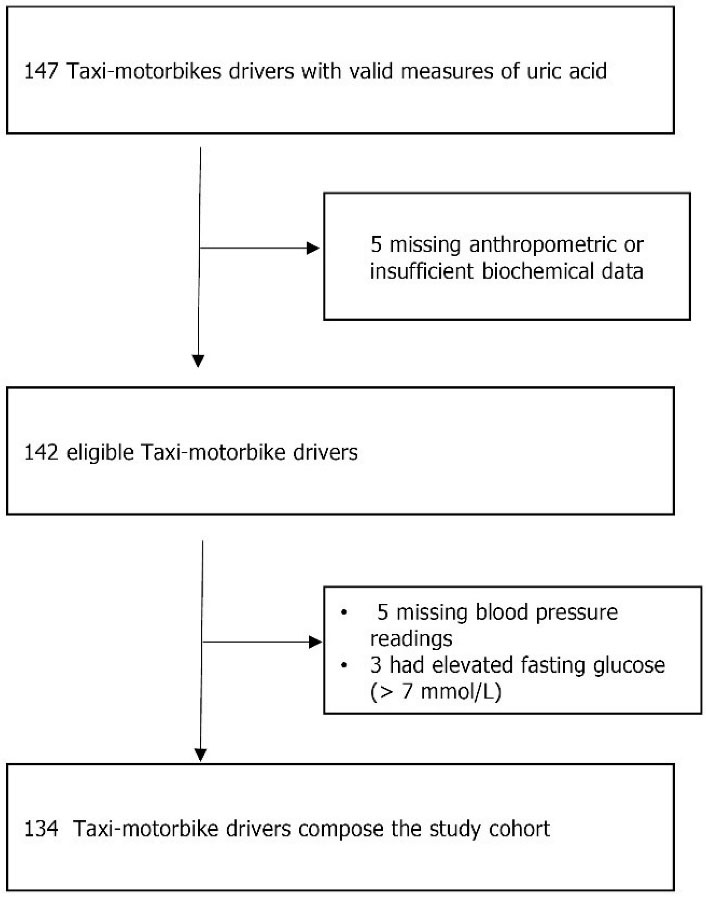
Figure 1.
Criteria for Inclusion and Exclusion of Study Participants.
.
Criteria for Inclusion and Exclusion of Study Participants.
Demographic and Clinical Characteristics
Clinical and metabolic variables of interest in this study included age, exposure duration, alcohol consumption, body mass index (BMI), systolic blood pressure (SBP), diastolic blood pressure (DBP), UA, glucose, creatinine, insulin, and blood lipids including total cholesterol (TC), triglycerides (TG), low-density lipoprotein cholesterol (LDL-C), and high-density lipoprotein cholesterol (HDL-C). All laboratory testings were conducted by standardized methods in the Research Unit NGERE (“Nutrition-Génétique-Exposition aux risques environnementaux”, Faculté de Médecine, Nancy, France).
Definitions of Variables
HUA was defined as plasma UA greater than 416 μmol/L, which is an accepted cut-off in male patients (7). The prevalence of HUA was determined as the proportion of study participants meeting the criteria for HUA. We defined hypertension as SBP ≥ 140 mm Hg or DBP ≥ 90 mm Hg (20). The homeostatic model assessment-insulin resistance (HOMA-IR) was calculated using the formula described by Matthews et al (21). HOMA-IR = fasting plasma insulin (µU/mL) x fasting plasma glucose (mmol/L) / 22.5. The 75th percentile of HOMA-IR values was used as the cut-off point for IR (21).
Statistical Analysis
Continuous variables are expressed as the mean (standard deviation), and categorical variables are expressed as percentages. We used the chi‐square test or Fisher’s exact test for comparison of categorical variables and the Mann‐Whitney U test for continuous variables. Logistic regression analysis was used to estimate the association of UA with clinical and metabolic factors. All statistical analyses were performed by IBM SPSS 20.0 software. The differences were considered statistically significantat a P < 0.05.
Results
A total of 134 participants, with a mean age of 39.3 years, were included in this study. Tables 1 and 2 summarize distributions of demographic and cardiometabolic risk factors for the whole study cohort based on HUA statuses or UA quartiles. Overall, 63 out of the 134 participants met the criteria of hypertension with a prevalence of 47.0 % (95% CI: 38.5-55.5%). The mean level of UA ( ± standard deviation) in the study population was 351.3 (68.3) µmol/L.
Of the 134 participants analyzed in this study, 26 met the criteria of HUA with an overall prevalence of 19.4% (95% CI: 12.7-26.1) as depicted in Table 1. The proportion of hyperuricemic patients in hypertensive was higher than that of non-hypertensive patients (12.7% versus 6.7%, respectively, P = 0.04).
Table 1.
Demographic, Clinical, and Metabolic Parameters in Patients With and Without Hyperuricemia
|
Variables
|
All Study Cohort (n=134)
|
Normouricemic (n=108)
|
Hyperuricemic (n=26)
|
P
Value
|
| Age (years), mean (SD) |
39.3 (7.7) |
39.4 (7.7) |
38.5 (7.7) |
0.67 |
| BMI (kg/m2), mean (SD) |
23.5 (3.8) |
23.3 (3.8) |
24.4 (3.9) |
0.19 |
| SBP (mm Hg), mean (SD) |
134.3 (18.7) |
132.7 (18.4) |
141.0 (19.2) |
0.04 |
| DBP (mm Hg), mean (SD) |
84.7 (13.2) |
83.9 (13.6) |
88.1 (11.0) |
0.07 |
| Uric acid (µmol/L), mean (SD) |
351.3 (68.3) |
327.3 (48.7) |
451.1 (43.0) |
< 0.01 |
| Exposure duration (years), mean (SD) |
11.5 (6.0) |
11.6 (5.9) |
11.0 (6.3) |
0.55 |
| Creatinine (mg/L), mean (SD) |
11.6 (1.3) |
11.7 (1.4) |
11.2 (1.0) |
0.12 |
| Insulin (µU/mL), mean (SD) |
26.0 519.5) |
24.9 (18.3) |
30.3 (24.1) |
0.30 |
| Glucose (mmol/L), mean (SD) |
4.2 (0.6) |
4.2 (0.8) |
4.2 (0.8) |
0.18 |
| HOMA-IR, mean (SD) |
4.9 (3.8) |
4.6 (3.3) |
6.1 (5.4) |
0.39 |
| TC (mmol/L), mean (SD) |
4.3 (0.9) |
4.3 (0.9) |
4.5 (1.0) |
0.39 |
| TG (mmol/L), mean (SD) |
0.8 (0.4) |
0.7 (0.3) |
1.0 (0.5) |
< 0.01 |
| HDL-C (mmol/L), mean (SD) |
1.3 (0.4) |
1.3 (0.4) |
1.4 (0.3) |
0.44 |
| LDL-C (mmol/L), mean (SD) |
2.6 (0.8) |
2.6 (0.7) |
2.6 (0.9) |
0.89 |
| Alcohol use, No. (%) |
52 (38.8) |
39 (36.1) |
13 (50.0) |
0.26 |
| IR, No. (%) |
32 (23.9) |
22 (20.4) |
10 (38.5) |
0.05 |
| Prevalence of HUA, No. (%) |
26 (19.4) |
− |
− |
− |
| Hypertension, No. (%) |
63 (47.0) |
46 (42.6) |
17 (65.4) |
0.04 |
Note. BMI: Body mass index; SBP: Systolic blood pressure; DBP: Diastolic blood pressure; HOMA-IR: Homeostatic model assessment for insulin resistance; TC: Total cholesterol; TG: Triglycerides; HDL-C: High-density lipoprotein cholesterol; LDL-C: Low-density lipoprotein cholesterol; IR: Insulin resistance.
Univariate analyses showed that TG, IR, hypertension, and BMI were significantly associated with UA levels. Other factors including, age, glucose, alcohol intake, TC, HDL-C, and LDL-C indicated no significant associations with UA levels (Tables 1 and 2).
Table 2.
Clinical and Metabolic Characteristics of Participants Based on Quartile of Uric Acid
|
|
Quartile of Uric Acid
|
|
1st (n=36), ≤97.5 µmol/L
|
2nd (n=28), 297.5-351.1 µmol/L
|
3rd (n=38), 351.1-394.2 µmol/L
|
4th (n=32),>394.2 µmol/L
|
P
Value
|
| Age (years) |
39.0 (7.6) |
39.3 (7.4) |
40.1 (8.3) |
38.6 (7.5) |
0.84 |
| BMI (kg/m2) |
21.5 (2.6) |
23.7 (2.9) |
24.4 (4.6) |
24.6 (4.1) |
< 0.01 |
| SBP (mm Hg) |
132.4 (23.0) |
128.2 (14.9) |
135.0 (15.5) |
140.8 (18.7) |
0.03 |
| DBP (mm Hg) |
85.0 (15.8) |
81.1 (11.0) |
84.9 (13.8) |
87.5 (10.5) |
0.22 |
| Exposure duration (years) |
11.7 (6.4) |
11.6 (6.1) |
11.7 (5.5) |
10.9 (6.0) |
0.88 |
| Creatinine (mg/L) |
11.3 (1.7) |
11.5 (1.2) |
12.0 (1.1) |
11.4 (1.2) |
0.06 |
| Insulin (µU/mL) |
20.2 (12.2) |
25.3 (14.6) |
29.2 (24.4) |
29.4 (22.7) |
0.19 |
| Glucose (mmol/L) |
4.2 (0.5) |
4.1 (0.5) |
4.2 (0.6) |
4.3 (0.7) |
0.43 |
| HOMA-IR |
3.8 (2.5) |
4.7 (2.9) |
5.4 (4.1) |
5.9 (5.1) |
0.26 |
| TC (mmol/L) |
4.3 (0.9) |
4.5 (1.0) |
4.2 (0.9) |
4.3 (1.0) |
0.64 |
| TG (mmol/L) |
0.6 (0.2) |
0.7 (0.2) |
0.9 (0.5) |
1.0 (0.5) |
< 0.01 |
| HDL-C (mmol/L) |
1.4 (0.5) |
1.3 (0.4) |
1.2 (0.4) |
1.3 (0.3) |
0.24 |
| LDL-C (mmol/L) |
2.5 (0.6) |
2.8 (0.8) |
2.5 (0.7) |
2.5 (0.9) |
0.33 |
Note. BMI: Body mass index; SBP: Systolic blood pressure; DBP: Diastolic blood pressure; HOMA-IR: Homeostatic model assessment for insulin resistance; TC: Total cholesterol; TG: Triglycerides; HDL-C: High-density lipoprotein cholesterol; LDL-C: Low-density lipoprotein cholesterol.
Values are reported as mean (standard deviation).
As can be observed in Table 3, multivariable logistic regression demonstrated that IR (OR = 3.60, 95% CI: 1.27-10.22, P = 0.02), hypertension (OR = 2.75, 95% CI: 1.00-7.54, P = 0.05), TG (OR = 4.25, 95% CI: 1.39-12.98, P= 0.01), and creatinine (OR = 0.62, 95% CI: 0.41-0.94, P = 0.02) were independently associated with HUA.
Table 3.
Clinical and Metabolic Factors Independently Associated With Hyperuricemia in the Study Population
|
Variables
|
OR
|
95% CI
|
P
Value
|
| IR |
3.60 |
1.27-10.22 |
0.02 |
| Hypertension |
2.75 |
1.00-7.54 |
0.05 |
| TG (mmol/L) |
4.25 |
1.39-12.98 |
0.01 |
| Creatinine (mg/L) |
0.62 |
0.41-0.94 |
0.02 |
Note. OR: Odd ratio; CI: Confidence interval; IR: Insulin resistance; TG: Triglycerides.
Discussion
This study found that the overall prevalence of HUA was 19.4% among the population of TMDs in Cotonou. To the best of our knowledge, only a few studies determined the prevalence of HUA in apparently healthy subjects from African populations (22). However, our estimates are similar to those reported in other parts of the world. For example, HUA prevalence was 21.4% in Japan (23), 13% in China (24), and 17.2% in the rural population of Nigeria (22). Notably, our estimate of HUA was higher than that reported in Bangladeshi adults with 9.3 % prevalence (25).
The results obtained in this study indicated that TG level was an independent risk factor for HUA. This finding confirmed reports of previous studies that showed a linear relationship between TG and UA levels (26-28). The molecular mechanisms by which HUA is associated with the elevated TG levels remain unproven. Overproduction of fatty acids in the liver is speculated to increase the synthesis of de novo purine, resulting in the increased UA production (29).
IR is one of the most significant contributing factors to HUA in the current study. The univariate analysis revealed that BMI, hypertension, and elevated TG are associate with HUA. However, these factors were found to be closely associated with IR. Therefore, it is possible that the association between IR and UA could be ascribed to these factors (30). Multivariate logistic regression showed a decrease in OR, but the association remained statistically significant. This observation suggests that none of the potential confounders impacted the link between UA and IR similar to what was reported in previous studies (28,30-33). It was suggested that HUA, as a strong predictor of diabetes, precedes the development of both IR and T2D (11). However, no causal role of plasma UA on IR was found among the newly diagnosed T2D patients (32).
Data from the literature demonstrated the robust association of HUA with hypertension, impaired renal function, and CVDs. In our study, hypertension, one of the strongest risk factors for CVDs, was linearly associated with UA levels. A retrospective cohort study conducted in prehypertensive Japanese adults showed that HUA was a significant risk factor for developing hypertension (16). Another multicenter study by Lin et al (34) examined the association between UA levels and changes in renal function in patients with hypertension. These authors demonstrated that the elevated UA levels were correlated with increased serum creatinine level (34), a marker of kidney function. In a cross-sectional and subsequently prospective study performed among adults who took their health checkups, Ni et al (35) showed that creatinine was associated with risk for incident HUA. However, in our study, UA level was inversely associated with creatinine. Possible explanations for this discrepancy can be related either to the study design or decreased creatinine generation due to reduced meat intake, renal secretion or degradation of creatinine, and fluid balance disorders such as dehydration (36).
The mechanisms by which UA induces IR or participates in CVDs remain unproven. Well-accepted pathophysiological mechanisms through which UA promotes CVDs include nitric oxide depletion, endothelial dysfunction, and its pro-oxidant activity in the cytoplasm or arteriosclerotic plaques (2). Evidence also suggests that UA may compromise insulin receptor substrate 1 and AKT insulin signaling, thereby contributing to IR (37). Some studies have demonstrated that IR enhances renal sodium reabsorption, resulting in hypertension (38). Furthermore, reactive oxygen species produced via activation of xanthine oxidoreductase or nicotinamide adenine dinucleotide phosphate oxidase are known to be required in the pathogenesis overlap between HUA and CVDs (2).
Taken together, obtained data in this study suggest the coexistence of multiple cardiovascular risk factors (e.g., hypertension, TG, and IR) in hyperuricemic TMDs. This increases their cardiovascular risk profile, which may be reduced if these markers are identified early and appropriate interventions administered.
This study had some limitations. The study participants were recruited only in Cotonou, with relatively small sample size. Thus, they might not represent the whole Beninese population. Other well-known correlates of HUA such as lifestyle behaviors (2) were not assessed in this study. As such, our estimates are prone to residual confounding from these factors that we did not consider in our analysis. Furthermore, our retrospective cross-sectional design does not account for temporality, and we were unable to certify whether the hyperuricemic status was transient or persistent. Therefore, it is impossible to draw conclusions based on the causality of the relationships between covariates and HUA. Further epidemiological studies are needed to investigate the prevalence of HUA along with its risk factors in populations of Benin. Despite these limitations, the current study is among initial studies to provide useful epidemiological data on the prevalence of HUA and identified some associated risk factors among the TMDs of Cotonou.
Conclusion
This study found that the prevalence of HUA was 19.4% in the TMDs. Further, hypertension, TG, creatinine, and IR were independently associated with HUA. These markers may help identify which individuals are at high risk of developing HUA.
Acknowledgments
We gratefully acknowledge taxi-moto drivers whose cooperation made this study possible. We also express our gratefulness to Professors Rosa-Maria Guéant-Rodriguez and Jean-Louis Guéant for their invaluable assistance toward the success of this work.
Authors’ Contribution
All authors contributed to the study design, participated to data acquisition. PHA performed laboratory work, analyzed data, and wrote the manuscript. All authors approved the final version submitted for publication and were fully responsible for its accuracy and integrity.
Conflict of Interests
The authors declare no competing interests.
Ethical Issues
The study was evaluated and approved by the Benin Environmental Agency.
Funding/Support
The Ministry of Higher Education and Scientific Research in Benin partially covered costs related to sample collection. Laboratory analyses performed in Nancy were fully funded by the Research Unit ‘INSERM UMRS 1256 NGERE: “Nutrition-Génétique-Exposition aux Risques Environnementaux”, Faculté de Médecine, Nancy, France.
References
- Li M, Hou W, Zhang X, Hu L, Tang Z. Hyperuricemia and risk of stroke: a systematic review and meta-analysis of prospective studies. Atherosclerosis 2014; 232(2):265-70. doi: 10.1016/j.atherosclerosis.2013.11.051 [Crossref] [ Google Scholar]
- Ndrepepa G. Uric acid and cardiovascular disease. Clin Chim Acta 2018; 484:150-63. doi: 10.1016/j.cca.2018.05.046 [Crossref] [ Google Scholar]
- Feig DI. Hyperuricemia and hypertension. Adv Chronic Kidney Dis 2012; 19(6):377-85. doi: 10.1053/j.ackd.2012.05.009 [Crossref] [ Google Scholar]
- Maiuolo J, Oppedisano F, Gratteri S, Muscoli C, Mollace V. Regulation of uric acid metabolism and excretion. Int J Cardiol 2016; 213:8-14. doi: 10.1016/j.ijcard.2015.08.109 [Crossref] [ Google Scholar]
- Johnson RJ, Sautin YY, Oliver WJ, Roncal C, Mu W, Gabriela Sanchez-Lozada L. Lessons from comparative physiology: could uric acid represent a physiologic alarm signal gone awry in western society?. J Comp Physiol B 2009; 179(1):67-76. doi: 10.1007/s00360-008-0291-7 [Crossref] [ Google Scholar]
- Desideri G, Castaldo G, Lombardi A, Mussap M, Testa A, Pontremoli R. Is it time to revise the normal range of serum uric acid levels?. Eur Rev Med Pharmacol Sci 2014; 18(9):1295-306. [ Google Scholar]
- You L, Liu A, Wuyun G, Wu H, Wang P. Prevalence of hyperuricemia and the relationship between serum uric acid and metabolic syndrome in the Asian Mongolian area. J Atheroscler Thromb 2014; 21(4):355-65. doi: 10.5551/jat.20529 [Crossref] [ Google Scholar]
- Qiao M, Chen C, Liang Y, Luo Y, Wu W. The influence of serum uric acid level on Alzheimer’s disease: a narrative review. Biomed Res Int 2021; 2021:5525710. doi: 10.1155/2021/5525710 [Crossref] [ Google Scholar]
- Mortada I. Hyperuricemia, type 2 diabetes mellitus, and hypertension: an emerging association. Curr Hypertens Rep 2017; 19(9):69. doi: 10.1007/s11906-017-0770-x [Crossref] [ Google Scholar]
- Grayson PC, Kim SY, LaValley M, Choi HK. Hyperuricemia and incident hypertension: a systematic review and meta-analysis. Arthritis Care Res (Hoboken) 2011; 63(1):102-10. doi: 10.1002/acr.20344 [Crossref] [ Google Scholar]
- Dehghan A, van Hoek M, Sijbrands EJ, Hofman A, Witteman JC. High serum uric acid as a novel risk factor for type 2 diabetes. Diabetes Care 2008; 31(2):361-2. doi: 10.2337/dc07-1276 [Crossref] [ Google Scholar]
- Bhole V, Choi JW, Kim SW, de Vera M, Choi H. Serum uric acid levels and the risk of type 2 diabetes: a prospective study. Am J Med 2010; 123(10):957-61. doi: 10.1016/j.amjmed.2010.03.027 [Crossref] [ Google Scholar]
- Weaver DJ Jr. Uric acid and progression of chronic kidney disease. Pediatr Nephrol 2019; 34(5):801-9. doi: 10.1007/s00467-018-3979-2 [Crossref] [ Google Scholar]
- Chukwuonye Chukwuonye, II II, Ohagwu KA, Adelowo OO, Chuku A, Obi EC, Onwuchekwa U. Prevalence and predictors of chronic kidney disease in a semiurban community in Lagos. Int J Nephrol 2019; 2019:1625837. doi: 10.1155/2019/1625837 [Crossref] [ Google Scholar]
- Padda J, Khalid K, Almanie AH, Al Hennawi H, Mehta KA, Wijeratne Fernando R. Hyperuricemia in patients with coronary artery disease and its association with disease severity. Cureus 2021; 13(8):e17161. doi: 10.7759/cureus.17161 [Crossref] [ Google Scholar]
- Kuwabara M, Hisatome I, Niwa K, Hara S, Roncal-Jimenez CA, Bjornstad P. Uric acid is a strong risk marker for developing hypertension from prehypertension: a 5-year Japanese cohort study. Hypertension 2018; 71(1):78-86. doi: 10.1161/hypertensionaha.117.10370 [Crossref] [ Google Scholar]
- Rafiullah M, Siddiqui K, Al-Rubeaan K. Association between serum uric acid levels and metabolic markers in patients with type 2 diabetes from a community with high diabetes prevalence. Int J Clin Pract 2020; 74(4):e13466. doi: 10.1111/ijcp.13466 [Crossref] [ Google Scholar]
- Avogbe PH, Ayi-Fanou L, Autrup H, Loft S, Fayomi B, Sanni A. Ultrafine particulate matter and high-level benzene urban air pollution in relation to oxidative DNA damage. Carcinogenesis 2005; 26(3):613-20. doi: 10.1093/carcin/bgh353 [Crossref] [ Google Scholar]
- Ayi-Fanou L, Avogbe PH, Fayomi B, Keith G, Hountondji C, Creppy EE. DNA-adducts in subjects exposed to urban air pollution by benzene and polycyclic aromatic hydrocarbons (PAHs) in Cotonou, Benin. Environ Toxicol 2011; 26(1):93-102. doi: 10.1002/tox.20533 [Crossref] [ Google Scholar]
- Joint Committee for Guideline Revision. 2018 Chinese guidelines for prevention and treatment of hypertension-a report of the revision committee of Chinese guidelines for prevention and treatment of hypertension. J Geriatr Cardiol 2019; 16(3):182-241. doi: 10.11909/j.issn.1671-5411.2019.03.014 [Crossref] [ Google Scholar]
- Matthews DR, Hosker JP, Rudenski AS, Naylor BA, Treacher DF, Turner RC. Homeostasis model assessment: insulin resistance and beta-cell function from fasting plasma glucose and insulin concentrations in man. Diabetologia 1985; 28(7):412-9. doi: 10.1007/bf00280883 [Crossref] [ Google Scholar]
- Alikor CA, Emem-Chioma PC, Odia OJ. Prevalence of hyperuricaemia in a rural population of Nigerian Niger Delta region. Niger J Med 2013; 22(3):187-92. [ Google Scholar]
- Shirasawa T, Ochiai H, Yoshimoto T, Nagahama S, Watanabe A, Yoshida R. Cross-sectional study of associations between normal body weight with central obesity and hyperuricemia in Japan. BMC Endocr Disord 2020; 20(1):2. doi: 10.1186/s12902-019-0481-1 [Crossref] [ Google Scholar]
- Wu J, Qiu L, Cheng XQ, Xu T, Wu W, Zeng XJ. Hyperuricemia and clustering of cardiovascular risk factors in the Chinese adult population. Sci Rep 2017; 7(1):5456. doi: 10.1038/s41598-017-05751-w [Crossref] [ Google Scholar]
- Ali N, Perveen R, Rahman S, Mahmood S, Rahman S, Islam S. Prevalence of hyperuricemia and the relationship between serum uric acid and obesity: a study on Bangladeshi adults. PLoS One 2018; 13(11):e0206850. doi: 10.1371/journal.pone.0206850 [Crossref] [ Google Scholar]
- Qiu L, Cheng XQ, Wu J, Liu JT, Xu T, Ding HT. Prevalence of hyperuricemia and its related risk factors in healthy adults from Northern and Northeastern Chinese provinces. BMC Public Health 2013; 13:664. doi: 10.1186/1471-2458-13-664 [Crossref] [ Google Scholar]
- Zhang Y, Wei F, Chen C, Cai C, Zhang K, Sun N. Higher triglyceride level predicts hyperuricemia: a prospective study of 6-year follow-up. J Clin Lipidol 2018; 12(1):185-92. doi: 10.1016/j.jacl.2017.10.009 [Crossref] [ Google Scholar]
- Bo S, Cavallo-Perin P, Gentile L, Repetti E, Pagano G. Hypouricemia and hyperuricemia in type 2 diabetes: two different phenotypes. Eur J Clin Invest 2001; 31(4):318-21. doi: 10.1046/j.1365-2362.2001.00812.x [Crossref] [ Google Scholar]
- Matsuura F, Yamashita S, Nakamura T, Nishida M, Nozaki S, Funahashi T. Effect of visceral fat accumulation on uric acid metabolism in male obese subjects: visceral fat obesity is linked more closely to overproduction of uric acid than subcutaneous fat obesity. Metabolism 1998; 47(8):929-33. doi: 10.1016/s0026-0495(98)90346-8 [Crossref] [ Google Scholar]
- Mazidi M, Katsiki N, Mikhailidis DP, Banach M. The link between insulin resistance parameters and serum uric acid is mediated by adiposity. Atherosclerosis 2018; 270:180-6. doi: 10.1016/j.atherosclerosis.2017.12.033 [Crossref] [ Google Scholar]
- Yu P, Huang L, Wang Z, Meng X, Yu X. The association of serum uric acid with beta-cell function and insulin resistance in nondiabetic individuals: a cross-sectional study. Diabetes Metab Syndr Obes 2021; 14:2673-82. doi: 10.2147/dmso.s312489 [Crossref] [ Google Scholar]
- Hu X, Rong S, Wang Q, Sun T, Bao W, Chen L. Association between plasma uric acid and insulin resistance in type 2 diabetes: a Mendelian randomization analysis. Diabetes Res Clin Pract 2021; 171:108542. doi: 10.1016/j.diabres.2020.108542 [Crossref] [ Google Scholar]
- Bonora E, Capaldo B, Perin PC, Del Prato S, De Mattia G, Frittitta L. Hyperinsulinemia and insulin resistance are independently associated with plasma lipids, uric acid and blood pressure in non-diabetic subjects The GISIR database. Nutr Metab Cardiovasc Dis 2008; 18(9):624-31. doi: 10.1016/j.numecd.2007.05.002 [Crossref] [ Google Scholar]
- Lin CS, Hung YJ, Chen GY, Tzeng TF, Lee DY, Chen CY. A multicenter study of the association of serum uric acid, serum creatinine, and diuretic use in hypertensive patients. Int J Cardiol 2011; 148(3):325-30. doi: 10.1016/j.ijcard.2009.11.024 [Crossref] [ Google Scholar]
- Ni Q, Lu X, Chen C, Du H, Zhang R. Risk factors for the development of hyperuricemia: a STROBE-compliant cross-sectional and longitudinal study. Medicine (Baltimore) 2019; 98(42):e17597. doi: 10.1097/md.0000000000017597 [Crossref] [ Google Scholar]
- Levey AS, Inker LA. GFR evaluation in living kidney donor candidates. J Am Soc Nephrol 2017; 28(4):1062-71. doi: 10.1681/asn.2016070790 [Crossref] [ Google Scholar]
- Zhu Y, Hu Y, Huang T, Zhang Y, Li Z, Luo C. High uric acid directly inhibits insulin signalling and induces insulin resistance. Biochem Biophys Res Commun 2014; 447(4):707-14. doi: 10.1016/j.bbrc.2014.04.080 [Crossref] [ Google Scholar]
- Forman JP, Choi H, Curhan GC. Uric acid and insulin sensitivity and risk of incident hypertension. Arch Intern Med 2009; 169(2):155-62. doi: 10.1001/archinternmed.2008.521 [Crossref] [ Google Scholar]