Avicenna Journal of Medical Biochemistry. 10(1):1-12.
doi: 10.34172/ajmb.2022.01
Original Article
Lactophorin in Camel Milk Undergoing Specific Proteolysis and Exhibiting Potent Anticancer Action against Human Colon and Breast Cancer Cells Through ROS Generation
Hisham R. Ibrahim 1, *  , Ahmed S. Ahmed 2, Airi Komeda 1, Takeshi Miyata 1
Author information:
1Department of Biochemistry and Biotechnology, Faculty of Agriculture, Kagoshima University, Kagoshima 890-0065, Japan
2Department of Food Hygiene and Control, Faculty of Veterinary Medicine, South Valley University, Qena 83523, Egypt
Abstract
Background: Camel milk has been recognized for its health benefits since ancient times and has recently been attracting increasing attention as a form of medical treatment for diverse human diseases. Studies on the health benefits of camel milk attributed its medicinal effects to nutritional status, but the molecular mechanisms of proteins involved in such effects remain unknown.
Objectives: The aim of this study was to explore the anticancer properties of camel milk proteins (CMPs).
Methods: CMPs were fractionated into camel casein proteins (CCPs) and camel whey proteins (CWPs). The CWP exhibited the most potent anticancer activity against colon (HCT-116) and breast (MCF-7) cancer cells. The CWP was further fractionated into cationic and anionic proteins using HiTrap cationic (SP-XL) and anionic (QFF) exchange columns.
Results: QFF-bound proteins (QFF-B) exhibited the strongest anticancer activities against both cancer cells. QFF-B proteins produced three peaks (P1~P3) on RP-HPLC, whereas P3 showed superior anticancer activity. The cytotoxic effects of CWP and QFF-B proteins are associated with increased production of intracellular ROS and subsequent apoptosis in both cancer cells. MALDI-TOF-MS identified lactophorin, glycation-dependent cell adhesion molecule1 (GlyCAM-1), and its three driven fragments as dominant peptides in QFF-B, while RP-HPLC-P3 contained two of them with molecular masses of 8080.3 and 9395.6 Da. The two peptides, both derived from the C-terminal of lactophorin, were the most representative peptides in the most active protein fractions (QFF-B and RP-HPLC-P3).
Conclusion: The results highlight for the first time that lactophorin is the major anti-cancer ingredient in camel milk and its unique C-terminal peptides present potential candidacy as anticancer agents in nutraceutical and pharmacological applications.
Keywords: Camel milk, Whey proteins, Lactophorin, Bio-peptides, Anti-oxidant, Anti-cancer,
Copyright and License Information
© 2022 The Author(s); Published by Hamadan University of Medical Sciences.
This is an open-access article distributed under the terms of the Creative Commons Attribution License (
http://creativecommons.org/licenses/by/4.0), which permits unrestricted use, distribution, and reproduction in any medium provided the original work is properly cited.
Please cite this article as follows: Ibrahim HR, Ahmed AS, Komeda A, Miyata T. Lactophorin in camel milk undergoing specific proteolysis and exhibiting potent anticancer action against human colon and breast cancer cells through ros generation. Avicenna J Med Biochem. 2022; 10(1):1-12. doi:10.34172/ajmb.2022.01
Background
Camel milk has traditionally been used to cure several illnesses in children and adults (1-4) as it exerts a number of therapeutic effects (5,6). Several studies have shown that camel milk possesses antioxidant, antimicrobial, and antihypertensive properties (7-9). We have recently shown that camel milk possesses potent antioxidant proteins and their peptides have significant reactive oxygen species (ROS)-scavenging activity (10). The active peptides showed significant protective effects against intracellular oxidative stress of eukaryotic cells. Oxidative stress is known to be associated with many diseases including inflammation and cancers (11). Oxidation-induced inflammation has been linked to the development and progression of several types of cancers (12,13) and cancer cells are engaged in interactions to form an inflammatory tumor microenvironment (14).
The tumor-bearing state is also said to be under oxidative stress associated with active oxygen production by tumor cells and accumulating evidence has revealed that excessive levels of ROS can damage DNA, leading to genomic instability which facilitates cancer progression (15). The transcription nuclear factor NF-κB modulates gene expression is involved in diverse cellular processes such as stress responses, inflammation, cell proliferation, and apoptosis due to a variety of stimuli (16). ROS can both activate and repress NF-κB signaling and thus NF-κB pathway can have both anti- and pro-oxidant effects on the modulation of oxidative stress involved in the pathogenesis of several human diseases including cancers (17). Flavonoids were reported to act as antioxidants with anti-inflammatory, and anticancer properties, whereas cytotoxicity is related to the ability to disrupt the electron transport chain of cancer cells due to their ROS scavenging action (18). Hence, antioxidants can act as modulators of cellular redox setting, thereby downregulating the activation of NF-κB that in turn could halt cancer progression and malignancy.
The management of cancers presents a major challenge for medical sectors and remains a public health concern. Although there are different types of drugs used to treat cancer, such as hormonal therapy or targeted therapy, standard chemotherapy is still the traditional way to treat cancers. Chemotherapy is a treatment with chemicals that are cytotoxic to tumor cells. Chemotherapy is the use of drugs that either kill cancer cells (cure) or prevent cancer from spreading (control). Many different chemotherapy drugs are available but they can cause drug resistance and not all drugs used to treat cancer work in the same way (19). Most of these drugs have limitations due to toxicity to normal cells and suppression of the immune system (20). These drawbacks necessitate the search for natural therapy with reduced side effects. Therefore, the need for naturally occurring anticancer agents is of crucial importance. Camel milk has been traditionally known to treat various human diseases and have profound health benefits (21). Few studies reported the anticancer effect of whole camel milk (22) or fermented camel milk (8,23). Some studies have also shown the inhibitory effects of camel milk on pro-inflammatory cytokines (13,24). Surprisingly, no study has been done to explore these effects of the isolated components of camel milk. It is difficult to discern whether the anticancer or anti-inflammatory effects are unique to the whole camel milk or to a specific component. Further, no study is available on the role of proteins or the naturally occurring peptides of camel milk on cancer cells. Caseins (CN) and whey proteins are the two types of proteins in milk, constituting 80% and 20% of total proteins, respectively. Camel milk caseins are four phosphoproteins (αs1-, αs2-, β-, and κ-CN) with molecular masses ranging from 18 kDa to 25 kDa. Camel milk contains more whey proteins than bovine milk. Whey protein contains numerous soluble proteins with various properties as follows: (1) anionic proteins (whey acidic protein, lactalbumin, lactophorin (GlyCAM-1), serum albumin, lysozyme C, and lactadherin), (2) cationic proteins (lactoferrin, lactoperoxidase, and peptidoglycan recognition protein-1), and (3) immunoglobulins (25). The therapeutic potential of camel milk has been thought to be linked to some whey proteins, i.e., lactoferrin, lysozyme, and lactoperoxidase, based on earlier studies of homologous proteins of human and bovine milk (21,26). However, there is a lack of studies investigating the medicinal contribution of protein fractions of milk from nonbovine mammals, especially camels. Studies on camel milk protein hydrolysates revealed antioxidant, antidiabetic, antihypertension, and antibacterial activities (21). Hydrolysis of camel whey proteins (CWPs) with gastric pepsin and pancreatic enzymes revealed anticancer activity of hydrolysate against liver cancer cells HepG2 but the active peptides were not identified (27). However, CWPs have not received attention in regard to their anticancer properties. Therefore, exploring CWPs would provide novel information about the molecular mechanism of anticancer activity of camel milk. Further, the assessment of protein fractions of camel milk for their abilities to inhibit cancer cells is crucially needed and would be highly rewarding.
This study aimed to explore the anticancer activities of proteins and peptides of camel milk. The study involves fractionation of camel milk proteins into caseins and whey fractions. Whey proteins were further fractionated into cationic and anionic proteins to identify the active protein fraction as well as the naturally occurring peptides involved in the inhibition of proliferation of colon cancer (HCT-116) and breast cancer (MCF-7) cells. The study highlighted the contribution of an 8-kDa peptide derived from the glycosylation-dependent cell adhesion molecule-1 (GlyCAM1), also called lactophorin or PP3, in the anti-cancer action of camel milk and expanded the direction for production of a potential anticancer therapeutic peptide.
Materials and Methods
Materials
Raw camel milk was collected from farms (dromedary camels) in the vicinity of the South Valley University (Qena, Egypt). HiTrap QFF, a strong anion exchange chromatography column, and HiTrap SP-XL, a strong cation exchange chromatography column, were from Cytiva (MA, USA). TSK gel ODS-120T column was from TOSOH (Tokyo, Japan), and α-cyano-4-hydroxy-cinnamic acid (α-HCCA) was from Bruker Daltonik (Bremen, Germany). Porcine pepsin and 2’,7’-dichloro-dihydro-fluorescein diacetate (DCFH-DA) were from Sigma-Aldrich (Tokyo, Japan). CellTiter-Blue Cell Viability assay was from Promega (Tokyo, Japan), and McCoy 5a medium was from ICN (Invitrogen, Japan). DMEM (Dulbecco’s Modified Eagle’s Medium), E-MEM, acridine orange (AO), propidium iodide (PI), and trypan blue (TB) were from Nacalai Tesque (Kyoto, Japan). All other reagents were of analytical grade.
Fractionation of Camel Milk Proteins
Raw camel milk was delipidated by centrifugation at 5000 g for 30 minutes, and the supernatant was passed through 3 layers of gauze and referred to as camel milk proteins (CMPs). A portion of CMP was adjusted to pH 4.6 with 10% acetic acid and centrifuged at 5000 g for 10 minutes. The supernatant (whey proteins) and re-suspended precipitate (caseins) were dialyzed using 1000 MWCO tubes. These fractions were lyophilized and referred to as camel casein proteins (CCPs) and whey proteins (CWPs). Portions of CMP, CCP, and CWP were digested with pepsin and analyzed on reducing SDS-PAGE according to standard protocols as described earlier (28). Additionally, CWP was fractionated into anionic and cationic proteins with HiTrap QFF and HiTrap SP-XL columns, respectively, using FPLC BioLogic LP system. Both columns were equilibrated with 10 mM Tris-HCl buffer (pH 8.0) before loading CWP, and protein elution was achieved with a 10-500 mM NaCl gradient. Peaks were dialyzed and further subjected to separation using RP-HPLC with ODS-120T column by a linear gradient of 1% to 40% acetonitrile over 200 minutes, as described earlier (10). Elution of peptides was monitored at 214 nm. Protein fractions were dialyzed, freeze-dried, and re-suspended at the desired concentration in distilled water or PBS buffer.
Cell Lines and Cultures
Human colon carcinoma HCT-116 (ATCC# CCL-247) cell line was obtained from American Type Culture Collection (Rockville, MD) and human breast cancer MCF-7 (JCRB0134) cell line was obtained from JCRB Cell Bank (Osaka, Japan). HCT-116 cells were maintained in McCoy’s 5a media. MCF-7 cells were maintained in E-MEM media supplemented with non-essential amino acids and Na-pyruvate. All media were supplemented with 10% fetal bovine serum (FBS) and antibiotic-antimycotic solution. Working cultures were maintained at 37˚C in a humidified incubator with 5% CO2 and the media were changed every other day. Cell count and cell viability were monitored by trypan blue exclusion using TC10TM Automated Cell Counter (Bio-Rad).
Cell Proliferation and Cytotoxicity Assay
CellTiter-Blue assay based on cellular reduction of resazurin to the fluorescent product resorufin was used to assess cell proliferation and viability. Viable cells are able to reduce the dye but the dead cells rapidly lose this capacity once their membrane has been compromised. Briefly, cells were seeded at 100 µL/well (5 × 10³ cells/well) in 96-well black fluorescence plates in duplicates and cultured for 24 hours at 37°C. Then, they were treated with protein in PBS at concentrations of 50-200 μg/mL. Mock cells were treated with PBS alone. After 24 hours of treatment at 37°C, CellTiter-Blue reagent (20 µL/well) was added and the cells were incubated for 1 hour before recording fluorescence (RFU) at excitation and emission wavelengths of 560 nm and 590 nm, respectively, with an Infinite M200 FA plate reader (Tecan, Japan). After subtraction of controls and blank values, RFU read-outs were used to calculate the percentage of cell viability as follows:
Cell Viability (%) = RFU of treated cells / RFU of mock cells) x 100
Cytotoxicity was also monitored using acridine orange (AO)–propidium iodide (PI) staining and the cells were observed via fluorescence microscopy with Keyence BZ-9000 fluorescence microscope, as described earlier (29). Viable cells stained green by AO and dead cells stained red by PI while apoptotic cells showed asymmetrically localized red nuclei.
Intracellular ROS Assay
Intracellular ROS was measured using DCFH-DA which is a cell-permeant fluorogenic dye. DCFH-DA detects ROS and measures the degree of overall oxidative stress in the cell. After cell uptake, DCFH-DA is deacetylated by cellular esterases to a non-fluorescent compound, which is later oxidized by ROS into DCF. Then, DCF can be detected by fluorescence microscopy with maximum excitation and emission wavelengths of 495 nm and 529 nm, respectively. Cells were suspended in medium at a concentration of 105 cells/mL in 96-well black plate. Then, 100 μL of the suspension containing protein (50-200 μg/mL) was added and incubated for 1 hour at 37°C under 5% CO2. Oxidizing agent (100-400 µg/mL H2O2) was used as positive control. Cells were centrifuged at 2000 × g for 5 minutes and fluorescent redox probe DCFH-DA (1 mmol/L) in 100 μL PBS buffer (pH7.4) was added to 100 μL PBS buffer (pH7.4) and incubated for 30 minutes at 37°C. Emission was measured at 538 nm upon excitation at 485 nm using an Infinite M200 FA fluorescence microplate reader. Data were expressed as relative fluorescence unit (RFU). A portion of treated cells was used to measure viability with trypan blue using TC10 automated cell counter (Bio-Rad).
MALDI-TOF-MS
Matrix-assisted laser desorption ionization time of flight mass spectrometry (MALDI-TOF-MS) was employed for the identification of polypeptides in each fraction. An aliquot of polypeptide solution (20 µM) was mixed with a saturated solution of α-cyano-4-hydroxy-cinnamic acid (α-HCCA) (Bruker Daltonik, Bremen, Germany) in 1:2 (v/v). Then, a 0.5-µL aliquot was spotted onto a steel target plate and allowed to air-dry. Autoflex Speed mass spectrometer (Bruker Daltonik GmbH, Germany) in positive reflector mode was used with a mass range of 2000 to 20 000 Da. Protein calibration standard (5.7 to 16,9 kDa) was used for calibration according to instructions of the manufacturer (Bruker Daltonik GmbH, Germany). The peptide monoisotopic peak list was verified manually. The Mascot software (Boston, MA, USA) was used for protein identification in peptide mass fingerprint mode. The terminal sequences of proteins were identified by subjecting the major precursor ions in each peak to MS/MS analysis, using a de novo routine and an automated application of MASCOT and SEQUEST database.
Statistical Analysis
Experiments were carried out in duplicate or triplicate and mean values were used for the statistical analysis. Data obtained in the study were analyzed statistically by ANOVA using Microsoft Excel. Data show mean values, and error bars show standard deviations.
Results
Anti-proliferative Activity of Caseins and Whey Proteins
CMPs were fractionated into caseins (CCP) and whey (CWP) proteins. Since our earlier study showed that peptic digests of protein fractions exhibit strong antioxidant activities (10), the CMP and its CCP and CWP fractions were hydrolyzed with pepsin. The protein fractions and their hydrolysates were analyzed on reducing SDS-PAGE (Figure 1A). The CWP and CCP were successfully separated (CCP and CWP) and the three fractions were totally hydrolyzed into peptides smaller than 8 kDa (P-CCP, P-CWP, and P-CMP). The intact proteins and their digests were assessed for their abilities to inhibit the proliferation of human colon HCT-116 (Figure 1B) and breast MCF-7 (Figure 1C) cancer cell lines. Although the intact proteins (CMP, CWP, and CCP) exhibited anti-proliferative activities towards the two cancer cell lines, CWP showed a remarkable activity against HCT-116 (Figure 1B) and a stronger activity against MCF-7 (Figure 1C). The digests of caseins (P-CCP) and whey proteins (P-CWP) exhibited weaker activities than their intact proteins, while P-CMP totally lost activity. The results demonstrated that the intact CMPs possessed anti-cancer activity whereas CWP showed the strongest ability to reduce the proliferation of the two cancer cell lines, particularly against MCF-7.
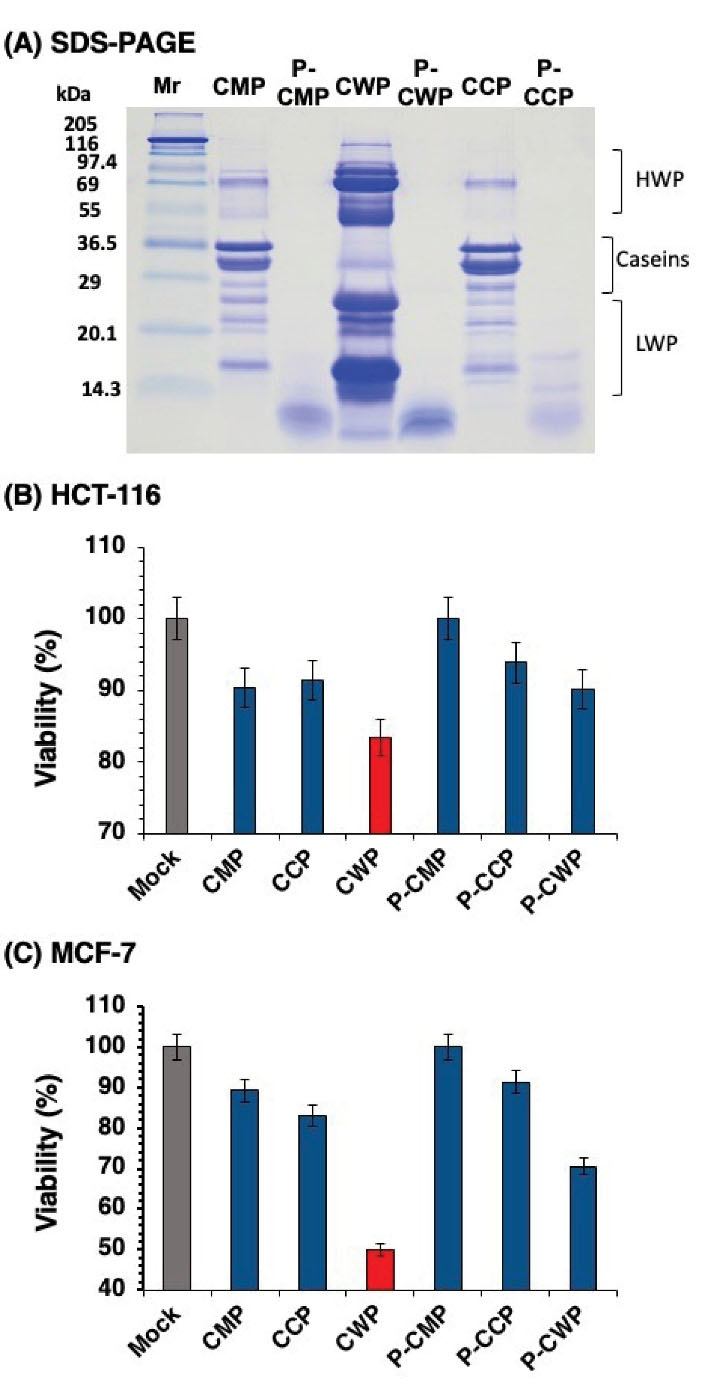
Figure 1.
Cell Proliferation of HCT-116 Colon Cancer and MCF-7 Breast Cancer Cells after 48 Hours of Incubation with Camel Milk Proteins Fractions and their Pepsin Digests. (A) the SDS-PAGE patterns of protein fractions and digests. (B) HCT-116 cell proliferation. (C) MCF-7 cell proliferation. CMP: camel milk proteins; CWP: camel whey proteins; CCP: camel casein proteins; P-CMP: pepsin-treated camel milk proteins; P-CWP: pepsin-treated camel whey proteins; P-CCP: pepsin-treated camel casein proteins; HWP: high molecular weight proteins; LWP: low molecular weight proteins.
.
Cell Proliferation of HCT-116 Colon Cancer and MCF-7 Breast Cancer Cells after 48 Hours of Incubation with Camel Milk Proteins Fractions and their Pepsin Digests. (A) the SDS-PAGE patterns of protein fractions and digests. (B) HCT-116 cell proliferation. (C) MCF-7 cell proliferation. CMP: camel milk proteins; CWP: camel whey proteins; CCP: camel casein proteins; P-CMP: pepsin-treated camel milk proteins; P-CWP: pepsin-treated camel whey proteins; P-CCP: pepsin-treated camel casein proteins; HWP: high molecular weight proteins; LWP: low molecular weight proteins.
Ion-Exchange Fractionation of Camel Whey Proteins
Proteins in CWP were separated into cationic and anionic protein fractions by passing through strong cation (SP-XL) and anion (QFF) exchange columns, respectively (Figure 2). Proteins were either bound to the column (-B) or passed through (-PT). For SP-XL column, the passthrough proteins, SP-XL-PT (Figure 2A), were more abundant than bound proteins, SP-XL-B (Figure 2B). However, the opposite was observed for QFF column and the bound proteins, QFF-B (Figure 2D) were more abundant than the passthrough proteins, QFF-PT (Figure 2C). The results demonstrate that majority of CWP proteins are anionic in nature.
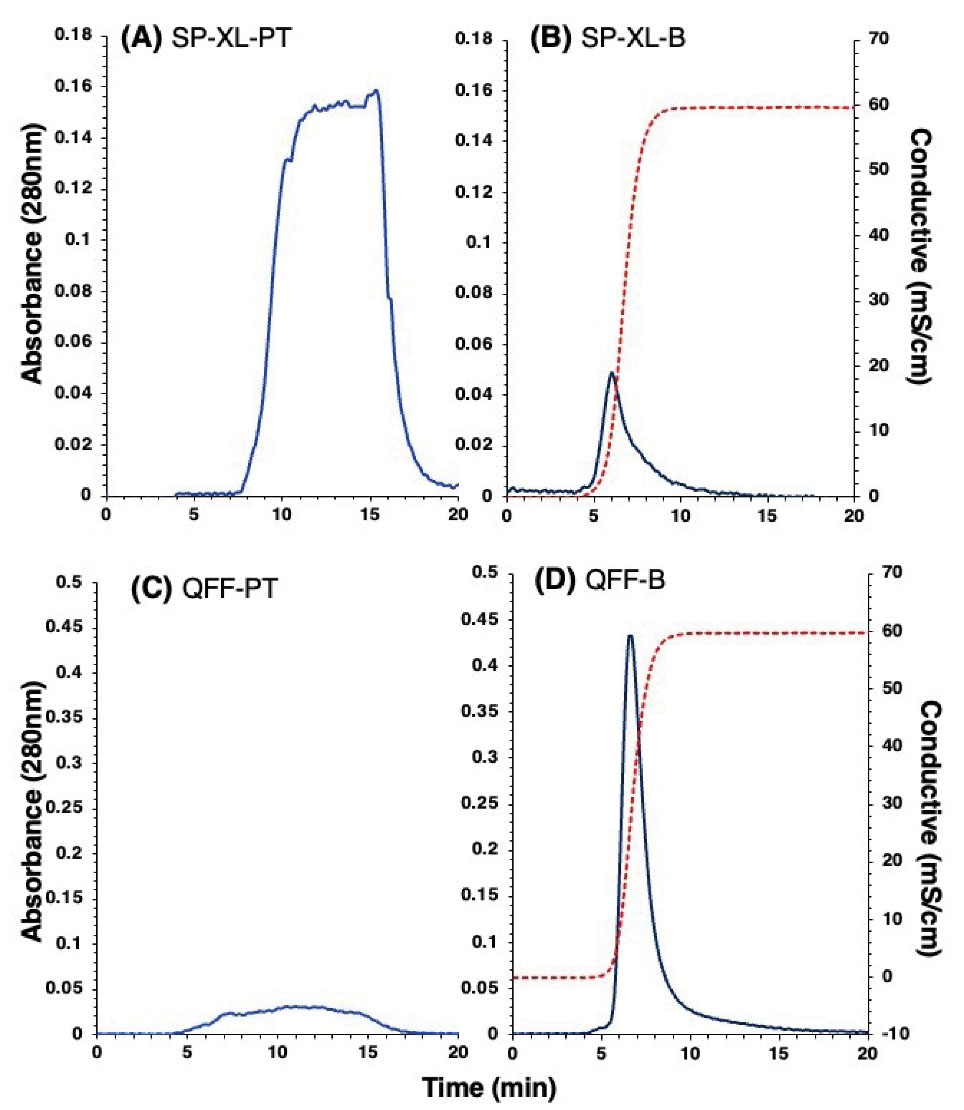
Figure 2.
HiTrap Ion-Exchange Chromatography Patterns on Cation Exchange (SP-XL) and Anion Exchange (QFF) Columns of Camel Whey Proteins (CWP). (A) The passthrough proteins from SP-XL column (SP-XL-PT) and (C) from QFF column (QFF-PT). (B) The bound proteins to SP-XL column (SP-XL-B) and (D) to QFF column (QFF-B). Elution of bound proteins was achieved with 0.5 M NaCl (dashed line), and absorbance was monitored at 280 nm.
.
HiTrap Ion-Exchange Chromatography Patterns on Cation Exchange (SP-XL) and Anion Exchange (QFF) Columns of Camel Whey Proteins (CWP). (A) The passthrough proteins from SP-XL column (SP-XL-PT) and (C) from QFF column (QFF-PT). (B) The bound proteins to SP-XL column (SP-XL-B) and (D) to QFF column (QFF-B). Elution of bound proteins was achieved with 0.5 M NaCl (dashed line), and absorbance was monitored at 280 nm.
The protein fractions were tested for anti-proliferative activity against HCT-116 (Figure 3A) and MCF-7 (Figure 3B) cells. As shown in Figure 3A, the QFF-B proteins showed much stronger anti-proliferative activity (34% viability) against HCT-116 cells than the total whey proteins, CWP (62% viability). Similarly, the QFF-B showed superior antiproliferative activities (36% viability) than the CWP (77% viability) against MCF-7 cells (Figure 3B). The passthrough proteins from SP-XL column (SP-XL-PT, anionic proteins) exhibited anti-proliferative activity against HCT-116, almost similar to that of CWP (Figure 3A) but stronger activity than CWP against MCF-7 (Figure 3B). The anionic proteins (QFF-B) showed the strongest anti-proliferative activity regardless of the cancer cell type, while the total whey proteins (CWP) exhibited variable activities against the two cancer cells with a more pronounced activity against HCT-116 cells.
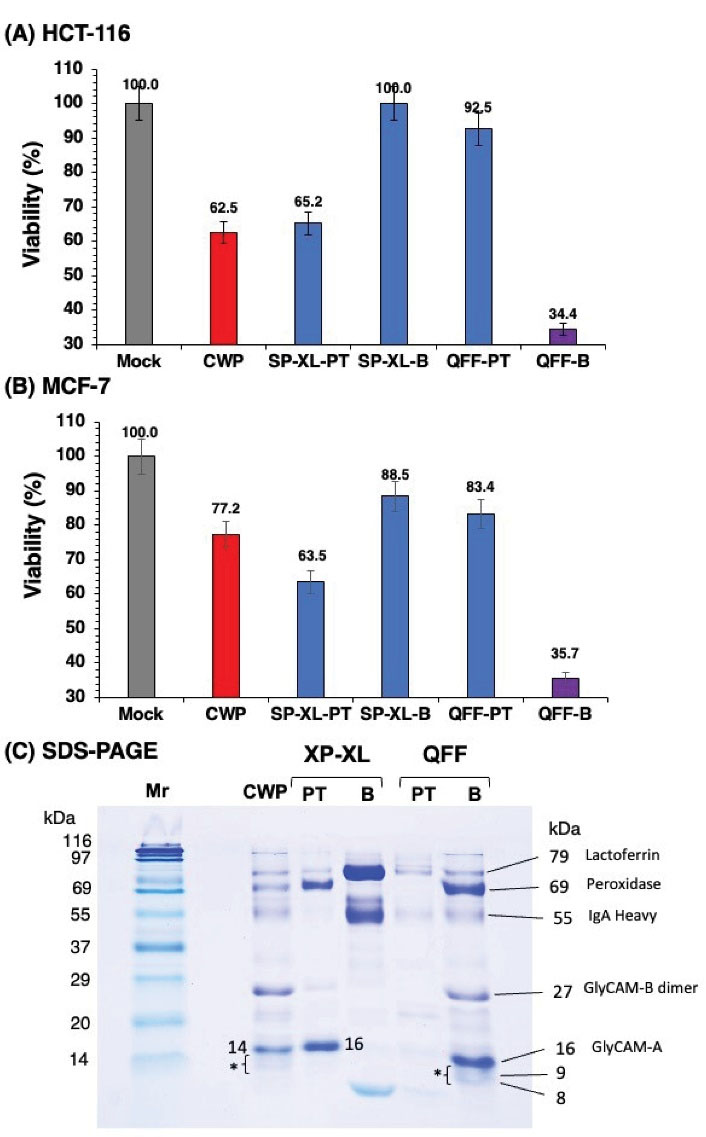
Figure 3.
Cell Proliferation of HCT-116 Colon Cancer (A) and MCF-7 Breast Cancer (B) Cells After 48 Hours of Incubation With HiTrap Ion Exchange Fractions of Camel Whey Proteins. (C) The SDS-PAGE Patterns of HiTrap Ion Exchange Fractions. PT: passthrough proteins; B: bound proteins; CWP: camel whey proteins; Mr: molecular weight marker.
.
Cell Proliferation of HCT-116 Colon Cancer (A) and MCF-7 Breast Cancer (B) Cells After 48 Hours of Incubation With HiTrap Ion Exchange Fractions of Camel Whey Proteins. (C) The SDS-PAGE Patterns of HiTrap Ion Exchange Fractions. PT: passthrough proteins; B: bound proteins; CWP: camel whey proteins; Mr: molecular weight marker.
SDS-PAGE, under reducing conditions, profiling of proteins in the ion-exchange fractions revealed compositional variations as depicted in Figure 3C. Three major bands with molecular masses of 69, 27, and 16 kDa were identified in the potent anticancer fraction QFF-B. According to the literature, the band with molecular masses of 16 kDa corresponds to variant A of lactophorin (GlyCAM-A, 137 residues), glycosylation-dependent cell adhesion molecule 1 (GlyCAM1), and a protein mass of 15 443 kDa (25)with O-linked core mass of 383.35~748.69 Da oligosaccharide (30). The band in QFF-B at 27 kDa corresponds to the homo-dimer of lactophorin variant B (GlyCAM-B, 122 residues), with a protein mass of 13,652.98 Da as reported (31). The band at 69 kDa corresponds to peroxidase (25,32) of camel milk. Below the band of 16 kDa in QFF-B, there were two low molecular mass bands at 9 and 8 kDa, which were also faintly observed in CWP (asterisked). In SP-XL-PT, only two major bands at 69 and 16 kDa were observed, which were assumed to be peroxidase and GlyCAM-A, respectively. In CWP, the band at 14.4 kDa corresponds to α-lactalbumin (33). The bands at 9 and 8 kDa found in both QFF-B and CWP have not been reported yet. Several low molecular weight bands have been found in the milk of several species that were identified as polypeptides arising from the enzymatic hydrolysis of proteins (34). The results indicate that fraction QFF-B contains dimer of lactophorin-B (27 kDa) and monomer of lactophorin-A (16 kDa), whereas they are likely to undergo proteolysis which may play a major role in the anti-proliferative activity of camel milk whey.
RP-HPLC Fractionation of QFF-B
Proteins in QFF-B fraction were separated into three peaks (P1~P3) using RP-HPLC (Figure 4A). Peak 3 (P3) exhibited strong anti-proliferative activity against HCT-116 cells (46% viability), comparable with the parent fraction QFF-B (54% viability). Peak 2 (P2) showed weak activity (91% viability) and peak 1 (P1) totally lost activity (Figure 4B). Peak 3 (P3) exhibited much stronger anti-proliferative activity against MCF-7 (33% viability), while peak 2 (P2) and peak 1 (P1) exhibited moderate activities (56% and 68% viability), respectively (Figure 4C). The results demonstrate that the most potent anti-proliferative activity is attributed to polypeptides in P3. The reducing SDS-PAGE analysis of RP-HPLC peaks is shown in Figure 4A. The P3 contained 4 major protein bands at apparent masses of 27, 16, 9, and 8 kDa, as calculated from their mobilities relative to the marker proteins. The P2 contained only the 16-kDa band and a faint band at 80 kDa. However, P1 exhibited two faint and diffused bands at 19 and 22 kDa with smearing at the lower part of the gel. Based on previous reports (25,35), the bands in QFF-B and P3 at apparent 27 and 16 kDa are assigned to the dimer of lactophorin-B (27 Da) and monomer of glycosylated lactophorin-A (15 440 Da) of camel milk, respectively. To the best of the author’s knowledge, there is no report in the literature on the presence of intrinsic polypeptides in camel milk with a molecular mass of 8 or 9 kDa. Since P2 contained primarily the 16-kDa band but showed weak anti-proliferative activity, the potent anti-proliferative activity of P3 and QFF-B could be mainly attributed to the 27-kDa and the peptides of 9 and 8 kDa.
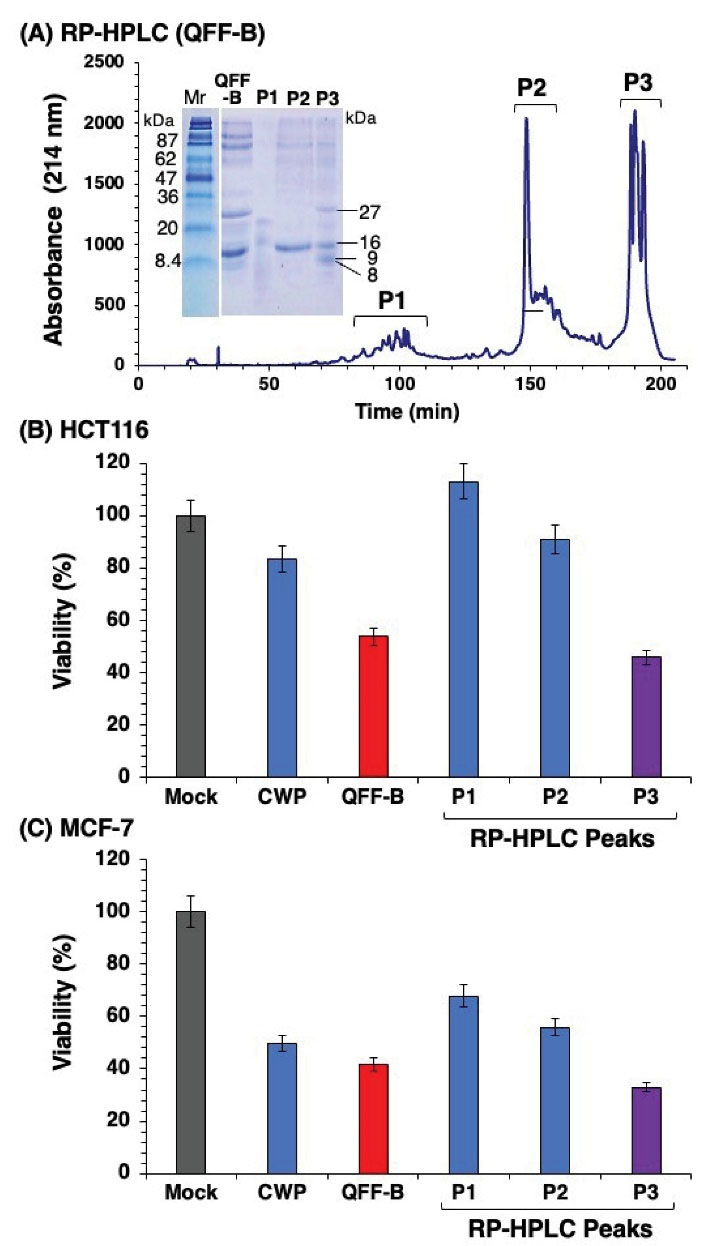
Figure 4.
RP-HPLC Patterns on a C18 Column and Cell Proliferation of QFF-B Fraction. (A) The patterns represent 3 peptide peaks (P1 to P3) with their SDS-PAGE patterns (inset). Cell proliferation of HCT-116 (B) and MCF-7 (C) cells was measured after 48 hours of incubation with RP-HPLC peaks, and was presented as percentage of viable cells.
.
RP-HPLC Patterns on a C18 Column and Cell Proliferation of QFF-B Fraction. (A) The patterns represent 3 peptide peaks (P1 to P3) with their SDS-PAGE patterns (inset). Cell proliferation of HCT-116 (B) and MCF-7 (C) cells was measured after 48 hours of incubation with RP-HPLC peaks, and was presented as percentage of viable cells.
Identification of Polypeptides in the Active Fractions
Polypeptides in QFF-B and P3 of RP-HPLC were identified using MALDI-TOF-TOF analysis (Figure 5). QFF-B contained 4 polypeptides with masses of 7913.08, 9027.85, 9393.38, and 15 864.17 m/z (Figure 5B and Table 1). The active peak of RP-HPLC (P3) contained mainly a polypeptide with a mass of 8080.33 m/z and two low-intensity polypeptides with masses of 9395.63 and 16225.47 m/z (Table 1 and Figure 5C). Protein sequencing by TOF-MS indicated that all polypeptides in QFF-B and P3 are derived from lactophorin (Table 1). The peak of approximately 8 kDa was the principal polypeptide (relative intensity of 100%) found in the active fraction and P3 (Figure 5C) as well as in the parent CWP (Figure 5A). This polypeptide (~ 8080 m/z) found in CWP and P3 originated from lactophorin A (residues Leu 66 to Gln 137) or lactophorin B (residues Leu 51 to Gln 122). The main polypeptide with a mass of 7913 m/z found in QFF-B originated from lactophorin A (residues Ser 55 to Lys 124) or lactophorin B (residues Ser 40 to Lys 109). The main polypeptide with a mass of 8080 m/z found in P3 as well as in CWP was also originated from lactophorin A (residues Leu 66 to Gln 137) or lactophorin B (residues Leu 51 to Gln 122). Cleavage specificity indicate that proteolysis of lactophorin occurred by plasmin, which is an endogenous protease in milk (36,37) (see the amino acid sequences of lactophorin A and B in Figure S1, Supplementary file 1).
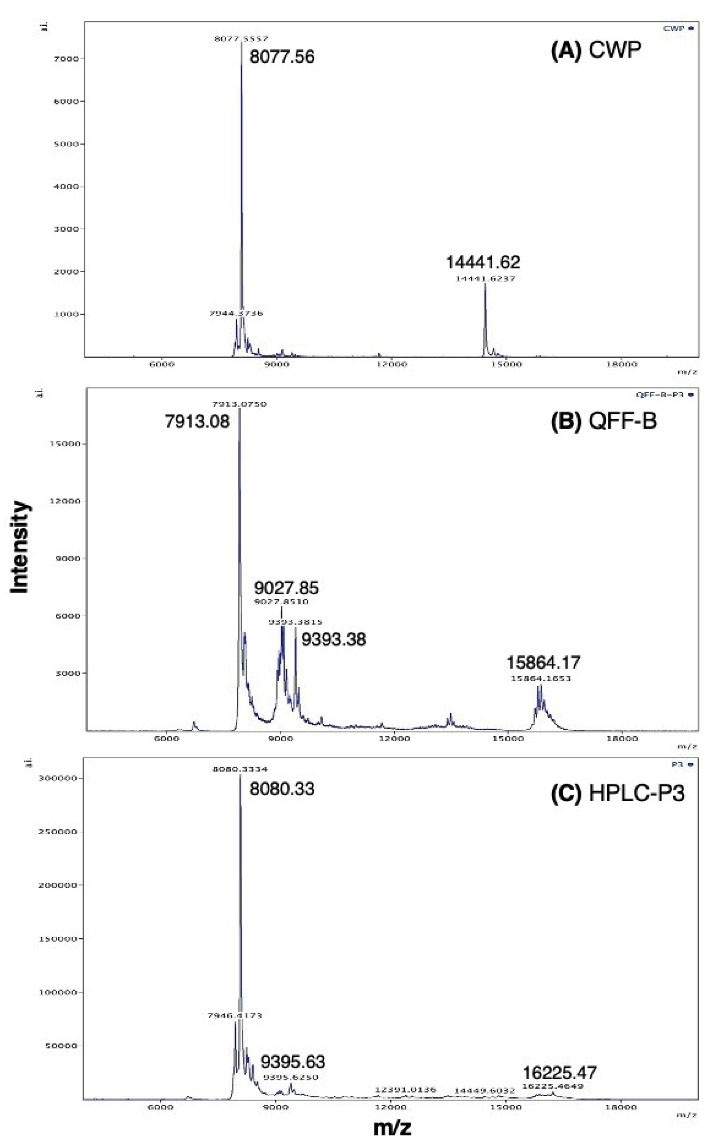
Figure 5.
MALDI-TOF Mass Spectra of Camel Whey Protein (CWP), QFF-B (B) and the RP-HPLC-Derived Peptide Peak 3 HPLC-P3 (C). The MS-MS sequences of the peptides are shown in Table 1, depicting the origin of the fragments within the source proteins. The sequence obtained by de novo sequencing of the fragments and the rest of peptide sequence was deduced from their molecular mass and assignment to protein NCBI database.
.
MALDI-TOF Mass Spectra of Camel Whey Protein (CWP), QFF-B (B) and the RP-HPLC-Derived Peptide Peak 3 HPLC-P3 (C). The MS-MS sequences of the peptides are shown in Table 1, depicting the origin of the fragments within the source proteins. The sequence obtained by de novo sequencing of the fragments and the rest of peptide sequence was deduced from their molecular mass and assignment to protein NCBI database.
Table 1.
Proteins and peptides identified by MALDI-TOF-MS in the active whey fractions of camel milk.
|
Fraction
|
Mass, m/z
|
Relative Intensity (%)
|
Protein
[Sequence*]
|
Residues (fragment)
|
|
|
Measured
|
Calculated
|
| CWP |
14441.62 |
14430.36 |
23.19 |
a-lactalbumin [123 aa full length] |
intact |
|
|
8077.56 |
8084.20 |
100.00 |
Lactophorin A/B fragment
[LLHPVPQESSFRNTATQSEETKELTPGAATTLEGKLVELTHKIIKNLENTMRETMDFLKSLFPHASEVVKPQ] |
72 aa
A (f 66 to 137)
B (f 51 to 122) |
| QFF-B |
15864.17 |
15902.73 |
14.64 |
Lactophorin A [full length] |
[intact + 5Pi] |
|
|
9393.38 |
9400.88 |
30.22 |
Lactophorin A/B fragment
[SARRHQNQNPKLLHPVPQESSFRNTATQSEETKELTPGAATTLEGKLVELTHKIIKNLENTMRETMDFLKSLFPHASEVVKPQ] |
83 aa
A (f 55 to 137)
B (f 40 to 122) |
|
|
9027.85 |
9086.71 |
10.40 |
Lactophorin A/B fragment
[RHQNQNPKLLHPVPQESSFRNTATQSEETKELTPGAATTLEGKLVELTHKIIKNLENTMRETMDFLKSLFPHASEVVKPQ] |
80 aa
A (f 58 to 137)
B (f 43 to 122) |
|
|
7913.08 |
7981.13 |
100.00 |
Lactophorin A/B fragment
[SARRHQNQNPKLLHPVPQESSFRNTATQSEETKELTPGAATTLEGKLVELTHKIIKNLENTMRETMDFLK] |
70 aa
A (f 55 to 124)
B (f 40 to 109) |
| HPLC-P3 |
16225.47 |
16192.50 |
2.14 |
Lactophorin A [full length] |
[intact + Glc + 5Pi] |
| |
9395.63 |
9400.88 |
3.82 |
Lactophorin A/B fragment
[SARRHQNQNPKLLHPVPQESSFRNTATQSEETKELTPGAATTLEGKLVELTHKIIKNLENTMRETMDFLKSLFPHASEVVKPQ] |
83 aa
A (f 55 to 137)
B (f 40 to 122) |
|
|
8080.33 |
8084.20 |
100.00 |
Lactophorin A/B fragment
[LLHPVPQESSFRNTATQSEETKELTPGAATTLEGKLVELTHKIIKNLENTMRETMDFLKSLFPHASEVVKPQ] |
72 aa
A (f 66 to 137)
B (f 51 to 122) |
QFF-B = anion exchange column bound fraction; HPLC-P3 = peak 3 from RP-HPLC of QFF-B; Lactophorin A = 137 aa length protein (P15522 called GlyCAM); Lactophorin B = 122 aa length protein; Pi = phosphorylation; Glc = glycosylation. *De novo peptide sequencing of the major peaks in MALDI-TOF was performed by manual interpretation of the ion series.
Although α-lactalbumin was detected, with a relative intensity of 23.19%, in CWP (Figure 5A and Table 1), the main peptide of 8077.56 Da was mainly released from lactophorin A or B (Table 1). This confirms that the potent anti-proliferative activity of the anionic whey proteins is mainly attributed to a peptide of 8 kDa derived from the C-terminal region of lactophorin.
Cytotoxic and Apoptotic Effects of Anionic Whey Proteins
Cytotoxicity was evaluated using acridine orange and propidium iodide (AO-PI) double staining (39). To examine the ability of QFF-B and its active RP-HPLC peak (P3) to induce cytotoxicity, the HCT-116 and MCF-7 cancer cells were incubated with proteins for 48 hours, the vital cells were measured by AO, and the dead (apoptotic) cells were determined by PI. Bright green round nuclei by AO were considered viable, faint green nuclei were considered metabolically inactive or dying, and bright red nuclei by PI were considered apoptotic with leaky membrane. Mock treated HCT-116 cells were intact with bright green round nuclei and no red signal was observed by PI staining, indicating good viability (Figure 6A). Upon treatment with QFF-B (Figure 6B) or its RP-HPLC (P3) (Figure 6C), apoptotic red signals were observed by PI staining. Cells treated with QFF-B or QFF-B (P3) showed a significant number of fragmented red nuclei (broken-line arrow) with faint green nuclei by AO staining, indicating apoptosis mediated cytotoxicity. Late-stage apoptotic cells, with concentrated and asymmetrically localized red nuclear staining (arrowhead), were also detected in HCT-116 cells treated with QFF-B or P3. A similar trend was observed when the cytotoxicity of QFF-B or QFF-B (P3) to MCF-7 cells was evaluated using AO-PI double staining (Figure 7). Treatment of MCF-7 cells with QFF-B (Figure 7B) or P3 (Figure 7C) revealed a high proportion of apoptotic cells with fragmented red nuclei by PI staining (broken-line arrow). QFF-B or P3 treatment produced a large proportion of abnormal MCF-7 nuclear morphology such as membrane blebbing and a concentrated form (granular) that is located in one side of cells whereas becoming near disintegration, indicating late apoptotic phase. The results demonstrated that the treatment of HCT-116 or MCF-7 cells with QFF-B or its RP-HPLC (P3) not only inhibited cell proliferation but also triggered the apoptotic process following 48 hours of incubation.
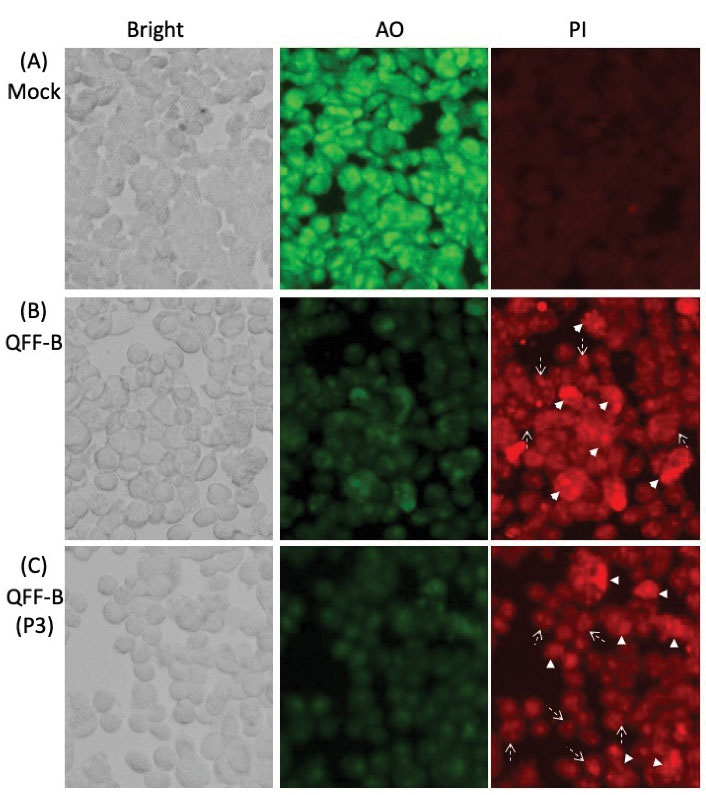
Figure 6.
Cell Staining Using Acridine Orange (AO)/Propidium Iodide (PI) of Human Colon Cancer Cells HCT-116 Incubated With QFF-B or its RP-HPLC Peak 3 (P3). (A) Untreated mock cells show green fluorescence by AO staining, circular nucleus uniformly distributed in the center of the cell. The nucleus of HCT-116 cells treated with QFF-B (B) or P3 (C) fraction for 48 hours, showing uneven red fluorescence by PI staining and nuclear fragmentation with margination of the nucleus, all associated with the apoptotic mode of cell death. Arrows-head indicate nucleus concentrated into a granular form that is located in one side of cells. Arrows with broken line indicate nuclear fragmentation.
.
Cell Staining Using Acridine Orange (AO)/Propidium Iodide (PI) of Human Colon Cancer Cells HCT-116 Incubated With QFF-B or its RP-HPLC Peak 3 (P3). (A) Untreated mock cells show green fluorescence by AO staining, circular nucleus uniformly distributed in the center of the cell. The nucleus of HCT-116 cells treated with QFF-B (B) or P3 (C) fraction for 48 hours, showing uneven red fluorescence by PI staining and nuclear fragmentation with margination of the nucleus, all associated with the apoptotic mode of cell death. Arrows-head indicate nucleus concentrated into a granular form that is located in one side of cells. Arrows with broken line indicate nuclear fragmentation.
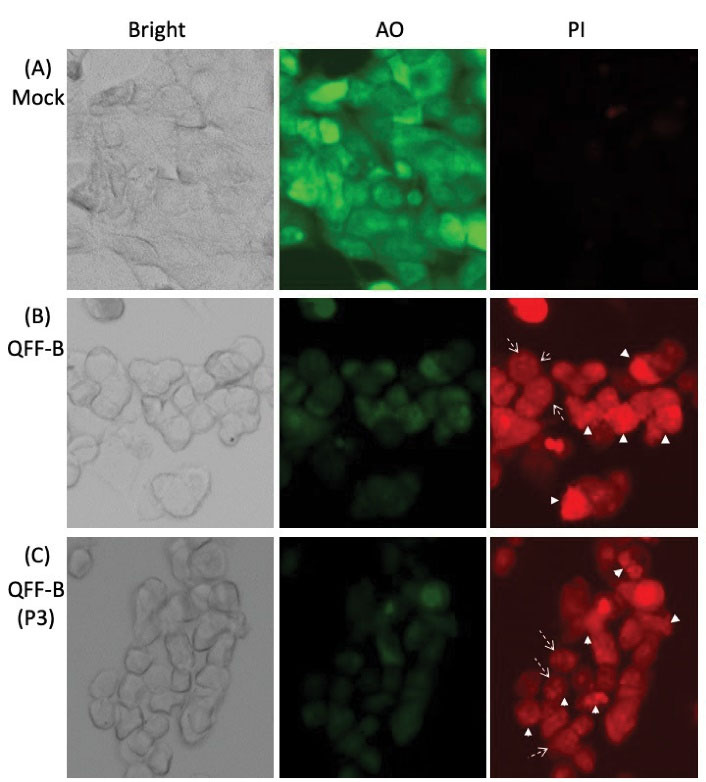
Figure 7.
Cell Staining Using Acridine Orange (AO)/Propidium Iodide (PI) of Human Breast Cancer Cells MCF-7 Incubated With QFF-B or its RP-HPLC Peak 3 (P3). Details are similar to that in legend of Figure 6.
.
Cell Staining Using Acridine Orange (AO)/Propidium Iodide (PI) of Human Breast Cancer Cells MCF-7 Incubated With QFF-B or its RP-HPLC Peak 3 (P3). Details are similar to that in legend of Figure 6.
Intracellular Reactive Oxygen Species
Since ROS generation is commonly associated with the activation of cell apoptosis (40), we compared the level of ROS generation in HCT-116 (Figure 8A) and MCF-7 (Figure 8B) cells treated with fractions of CMPs and their peptic digests. Cells were loaded with oxidation-sensitive fluorescent probe DCFH-DA and the fluorescence level of oxidized DCF was detected by spectrofluorometer readings. To ascertain whether the increase of the probe fluorescence correlated with oxidation, cells were treated with increasing concentrations of exogenous hydrogen peroxide, H2O2. Untreated cells (mock) were used to quantify basal oxidation. As can be seen in Figure 8, treatment with CWP dramatically increased the generation of ROS in both cancer cells, even more pronounced than treatment with H2O2. Treatment of both cells with exogenous H2O2 increased intracellular ROS levels with an increase of H2O2 concentration (Figure 8A and 8B). Milk proteins (CMP), CCP, peptic digests of CCP (P-CCP), and CMP (P-CMP) did not affect ROS generation, almost the same basal level of mock-treated cells. Peptic digestion of CWP (P-CWP) resulted in total abolishment of its DCF fluorescence. It is worth noting that treatment of MCF-7 cells with CWP generated more ROS (Figure 8B) compared to HCT-116 cells (Figure 8A), almost four folds of fluorescence level.
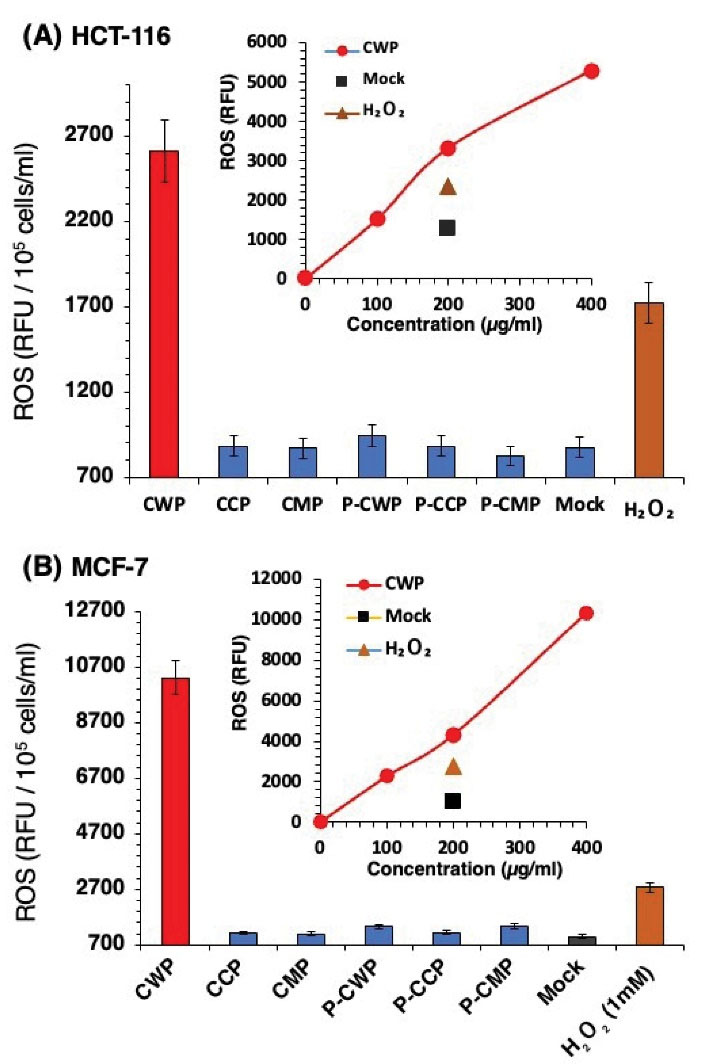
Figure 8.
Intracellular ROS in HCT-116 (A) and MCF-7 (B) Cells Treated for 1 Hour with Camel Milk Protein Fractions and Their Peptic Digests. Cells pre-loaded with the fluorescent probe DCFH-DA were exposed to 200 µg/mL protein. Fluorescence (485 nm (excitation) and 538 nm (emission) was quantified. Untreated cells (Mock) were used to quantify basal oxidation, while H2O2 was used as a positive control of oxidative stress. Inset panel show the dose-dependency of intracellular ROS increase when exposed to increasing concentrations of CWP. Data presented as ± SD, representative of 3 experiments (six replicates each).
.
Intracellular ROS in HCT-116 (A) and MCF-7 (B) Cells Treated for 1 Hour with Camel Milk Protein Fractions and Their Peptic Digests. Cells pre-loaded with the fluorescent probe DCFH-DA were exposed to 200 µg/mL protein. Fluorescence (485 nm (excitation) and 538 nm (emission) was quantified. Untreated cells (Mock) were used to quantify basal oxidation, while H2O2 was used as a positive control of oxidative stress. Inset panel show the dose-dependency of intracellular ROS increase when exposed to increasing concentrations of CWP. Data presented as ± SD, representative of 3 experiments (six replicates each).
As shown in Figure 9, HCT-116 (Figure 9A) or MCF-7 (Figure 9B) cells treated with SP-XL-B or QFF-PT fractions (cationic proteins) exhibited low intracellular ROS levels, while treatment with QFF-B fraction (anionic proteins) showed a higher ROS level than treatment with H2O2 but a lower ROS level than treatment with CWP (Figures 9A and 9B, QFF-B). Treatment with RP-HPLC P3 of QFF-B produced a higher level of ROS than treatment with H2O2 or the parent QFF-B fraction. The results demonstrated that whey proteins (CWP) possess anticancer activity against colon and breast cancer cells through their abilities to induce intracellular ROS, and its anionic proteins (QFF-B) are the major contributors.

Figure 9.
Intracellular ROS in HCT-116 (A) and MCF-7 (B) Cells Treated for 1 Hour With Camel Whey Proteins Fractionated Using Ion-Exchange Columns and RP-HPLC-P3 QFF Bound Protein (QFF-B). Cells were fluorescent probed and treated in similar manner as in Figure 8. Data represented as ± SD, representative of 3 experiments (six replicates each).
.
Intracellular ROS in HCT-116 (A) and MCF-7 (B) Cells Treated for 1 Hour With Camel Whey Proteins Fractionated Using Ion-Exchange Columns and RP-HPLC-P3 QFF Bound Protein (QFF-B). Cells were fluorescent probed and treated in similar manner as in Figure 8. Data represented as ± SD, representative of 3 experiments (six replicates each).
Discussion
For many years, plant-derived herbal compounds, such as polyphenols, flavonoids, or isoflavones, have been used for cancer treatment. These compounds have antioxidant activities and demonstrate abilities to inhibit cancer cell proliferation and DNA damage, act on mitotic disruptors, inhibit the activity of carcinogenic proteins or genes, and induce apoptotic cell death (40). Chemically derived drugs such as paclitaxel or cisplatin inhibit the dynamic of microtubules or cell cycle arrest of cancer cells, respectively (41). In this study, proteins in camel milk demonstrated potential anticancer properties by inducing excessive intracellular ROS, leading to apoptotic cell death of two cancer cell lines. Camel milk has been used as a source of food and a means of vital medicines for diverse illnesses in arid regions of Asia, Africa, and Australia. In recent years, a number of studies identified certain medical conditions that have been treated with whole or fermented camel milk, including cancer (22), chronic hepatitis (42), and peptic ulcers (12). The therapeutic properties of camel milk have recently been the subject of numerous studies. Previous studies using hepatoma (HepG2) and breast (MCF-7) cancer cells reported anticancer properties of the whole camel milk (22,43) or CWP hydrolysates (27). Camel milk, freeze-dried, has been reported to inhibit the proliferation of hepatoma cancer cells (44). Further, lactoferrin and α-lactalbumin of raw and formulated camel milk have been shown to exert anti-proliferative effect on cancer cells (45,46).
Camel milk is an intricate mixture of bioactive proteins, lipids, and carbohydrates that impart its medicinal properties. It was impossible to discern if the observed anticancer activity is unique to a certain component or it is the combined effect of various components that work synergistically. Camel milk contains large amounts of proteins with different structural and physiological properties. Considering the pivotal role of proteins in the control of wound healing and their antioxidant and immunomodulatory properties (24,28,47), we hypothesized that the anticancer effects of camel milk may be attributed to the action of a specific protein or a group of proteins that work synergistically. To address this question, we examined the effect of camel milk and its fractions on human colorectal (HCT-116) and breast (MCF-7) cancer cells. For this purpose, proteins were separated into caseins and whey, and the whey proteins were further fractionated into anionic and cationic groups. CWPs exhibited much stronger anti-proliferative activity than CCPs or the total CMPs against HCT-116 and MCF-7 cells (Figure 1). The anionic whey proteins (QFF-B) showed more pronounced anti-proliferative activity than the parent CWP against HCT-116 and MCF-7 cells (Figures 3A and 3B). RP-HPLC peak3 of QFF-B (HPLC-P3) exhibited more potent anti-proliferative activity than QFF-B fraction (Figures 4B and 4C). QFF-B fraction comprised lactophorin variant A (15864.17 Da) and 3 fragments from lactophorin (7913.08, 9027.85, and 9393.38 Da) with the 7913.08 Da fragment being the main component, 100% relative intensity (Figure 5B and Table 1). The HPLC-P3 comprised mainly peptide with a mass of 8080.33 Da derived also from lactophorin (either variant A or B) (Figure 5C), which corresponds to the residues Leu66-Gln137 of variant A or residues Leu51-Gln122 of variant B (Table 1). It is noteworthy that CWP comprised mainly the same peptide from lactophorin (either variant A or B) with a mass of 8077.56 Da (Figure 5A and Table 1).
Studies show that lactophorin is heterogeneous, whereas its SDS–PAGE patterns are different among the preparations (31). Lactophorin in bovine milk is composed of 135 amino acid residues but composed of 137 (variant A) or 122 (variant B) amino acid residues in camel milk (37,48). Lactophorin sequence contains five phosphorylated serines and an O-glycosylation site (48) (Figure S1). Studies on bovine milk lactophorin revealed that it exists in several forms, and it has been shown to be cleaved by plasmin, an endogenous protease in milk, between Arg53 and Ser54 (36,49). In camel milk, we found that lactophorin is cleaved between Lys54 and Ser55 of variant A or Lys39 and Ser40 of variant B (Figure S1), thus releasing 83-residue C-terminal peptide with a mass of 9395 Da detected in the active fractions QFF-B and its RP-HPLC-P3 (Table 1 and Figure 5). This peptide was further cleaved at Lys124 to produce a 70-residue peptide with a mass of 7913 Da, which was dominantly found in QFF-B fraction (Table 1 and Figure S1). The dominant peptide in both CWP and RP-HPLC-P3 of 8080 Da is the result of cleavage between Lys65 and Leu66 of variant A or Lys50 and Leu51 of variant B (Table 1 and Figure S1). It can be concluded that the C-terminal peptide of lactophorin seems to make a major contribution to the anti-cancer activity of CWPs. The C-terminal plasmin-digest of bovine lactophorin contains an amphipathic α-helix region, which has the ability to attach to the membrane by oligomerizing through the C-terminal amphipathic helical region (31,38), which supports the ability of fractions containing this peptide (QFF-B and P3) to damage the membranes of both HCT-116 (Figure 6) and MCF-7 (Figure 7) cancer cells. Peptides (9393.38, 8080.33, and 7913.08 Da) derived from camel milk lactophorin found in this study are predicted to adopt amphiphilic helical structures (Figure S2, Supplementary file 1).
It is noteworthy that peptides were generated from a soluble protein specific to camel whey, lactophorin (GlyCAM-1). The concentration of GlyCAM-1 in camel milk was found to be about three times higher than the concentration in bovine milk (33). The GlyCAM-1 is in fact a minor component in the milk of most of the species studied (approximately 300 mg/L in bovine milk), but its concentration in camel milk is high and ranges from approximately 1 g/L to approximately 5 g/L (50). Surprisingly, the fraction containing lactoferrin exhibited no anti-proliferative activity against HCT-116 and very weak activity against MCF-7 (Figure 3, SP-XL-B). Alpa-lactalbumin has been reported to possess anticancer activity, which is determined by the ability of this protein to form complexes with oleic acid (46). Alpha-lactalbumin was not detected in ion exchange fractions but was faintly found in CWP. The reported wide variation of α-lactalbumin concentration in camel milk (51) seems likely to contribute to the scarcity of this protein in milk of this study. This is also in line with the notion that α-lactalbumin binds to insoluble milk components, such as fatty acids or caseins (51,52), and thus did not pass through the columns.
Conclusion
In conclusion, our findings indicated that the proteolysis of whey GlyCAM-1 protein by the endogenous plasmin in camel milk can help to understand the anticancer properties of camel milk. Our data explore for the first time that lactophorin undergoes cleavage at specific sites to produce unique 8 kDa C-terminal peptides with potential anticancer activities. Anticancer activity uniquely involves the generation of excessive intracellular ROS and subsequent induction of apoptosis in both colorectal and breast cancer cells. Based on the results of this study, lactophorin in camel milk can be a promising candidate for nutraceuticals and therapeutics against cancers. The potent anticancer activity of camel lactophorin and its new peptides found in this study would merit pharmacokinetic studies and clinical trial investigations that could have benefits for cancer patients.
Authors’ Contribution
Conception and design of research: HRI, Performed experiments: HRI, ASA and AK, Analyzed data: HRI and ASA, Interpretation of the results of experiments: HRI, Prepared figures: HRI and ASA.
Drafted the manuscript: HRI, ASA and TM.
Conflict of Interests
The authors declare no potential conflicts of interest relevant to this article.
Ethical Issues
Not applicable.
Funding/Support
Not applicable.
Supplementary Files
Supplementary file 1 contains Figures S1 and S2.
(pdf)
References
- Abdulrahman AO, Ismael MA, Al-Hosaini K, Rame C, Al-Senaidy AM, Dupont J. Differential effects of camel milk on insulin receptor signaling-toward understanding the insulin-like properties of camel milk. Front Endocrinol (Lausanne) 2016; 7:4. doi: 10.3389/fendo.2016.00004 [Crossref] [ Google Scholar]
- Agrawal RP, Dogra R, Mohta N, Tiwari R, Singhal S, Sultania S. Beneficial effect of camel milk in diabetic nephropathy. Acta Biomed 2009; 80(2):131-4. [ Google Scholar]
- Arab HH, Salama SA, Abdelghany TM, Omar HA, Arafa EA, Alrobaian MM. Camel milk attenuates rheumatoid arthritis via inhibition of mitogen activated protein kinase pathway. Cell Physiol Biochem 2017; 43(2):540-52. doi: 10.1159/000480527 [Crossref] [ Google Scholar]
- Yagil R. Camel milk and its unique anti-diarrheal properties. Isr Med Assoc J 2013; 15(1):35-6. [ Google Scholar]
- Hailu Y, Hansen EB, Seifu E, Eshetu M, Ipsen R, Kappeler S. Functional and technological properties of camel milk proteins: a review. J Dairy Res 2016; 83(4):422-9. doi: 10.1017/s0022029916000686 [Crossref] [ Google Scholar]
- Mihic T, Rainkie D, Wilby KJ, Pawluk SA. The therapeutic effects of camel milk: a systematic review of animal and human trials. J Evid Based Complementary Altern Med 2016; 21(4):NP110-26. doi: 10.1177/2156587216658846 [Crossref] [ Google Scholar]
- Al-Ayadhi LY, Elamin NE. Camel milk as a potential therapy as an antioxidant in autism spectrum disorder (ASD). Evid Based Complement Alternat Med 2013; 2013:602834. doi: 10.1155/2013/602834 [Crossref] [ Google Scholar]
- Ayyash M, Al-Nuaimi AK, Al-Mahadin S, Liu SQ. In vitro investigation of anticancer and ACE-inhibiting activity, α-amylase and α-glucosidase inhibition, and antioxidant activity of camel milk fermented with camel milk probiotic: a comparative study with fermented bovine milk. Food Chem 2018; 239:588-97. doi: 10.1016/j.foodchem.2017.06.149 [Crossref] [ Google Scholar]
- el Agamy EI, Ruppanner R, Ismail A, Champagne CP, Assaf R. Antibacterial and antiviral activity of camel milk protective proteins. J Dairy Res 1992; 59(2):169-75. doi: 10.1017/s0022029900030417 [Crossref] [ Google Scholar]
- Ibrahim HR, Isono H, Miyata T. Potential antioxidant bioactive peptides from camel milk proteins. Anim Nutr 2018; 4(3):273-80. doi: 10.1016/j.aninu.2018.05.004 [Crossref] [ Google Scholar]
- Halliwell B. Free radicals, antioxidants, and human disease: curiosity, cause, or consequence?. Lancet 1994; 344(8924):721-4. doi: 10.1016/s0140-6736(94)92211-x [Crossref] [ Google Scholar]
- Hu Z, Chang X, Pan Q, Gu K, Okechukwu PN. Gastroprotective and ulcer healing effects of camel milk and urine in HCl/EtOH, non-steroidal anti-inflammatory drugs (indomethacin), and water-restraint stress-induced ulcer in rats. Pharmacogn Mag 2017; 13(52):559-65. doi: 10.4103/pm.pm_135_17 [Crossref] [ Google Scholar]
- Zhu WW, Kong GQ, Ma MM, Li Y, Huang X, Wang LP. Short communication: camel milk ameliorates inflammatory responses and oxidative stress and downregulates mitogen-activated protein kinase signaling pathways in lipopolysaccharide-induced acute respiratory distress syndrome in rats. J Dairy Sci 2016; 99(1):53-6. doi: 10.3168/jds.2015-10005 [Crossref] [ Google Scholar]
- Greten FR, Grivennikov SI. Inflammation and cancer: triggers, mechanisms, and consequences. Immunity 2019; 51(1):27-41. doi: 10.1016/j.immuni.2019.06.025 [Crossref] [ Google Scholar]
- Zhao H, Wu L, Yan G, Chen Y, Zhou M, Wu Y. Inflammation and tumor progression: signaling pathways and targeted intervention. Signal Transduct Target Ther 2021; 6(1):263. doi: 10.1038/s41392-021-00658-5 [Crossref] [ Google Scholar]
- Mirzaei S, Zarrabi A, Hashemi F, Zabolian A, Saleki H, Ranjbar A. Regulation of Nuclear Factor-KappaB (NF-κB) signaling pathway by non-coding RNAs in cancer: inhibiting or promoting carcinogenesis?. Cancer Lett 2021; 509:63-80. doi: 10.1016/j.canlet.2021.03.025 [Crossref] [ Google Scholar]
- Lingappan K. NF-κB in oxidative stress. Curr Opin Toxicol 2018; 7:81-6. doi: 10.1016/j.cotox.2017.11.002 [Crossref] [ Google Scholar]
- Grigalius I, Petrikaite V. Relationship between antioxidant and anticancer activity of trihydroxyflavones. Molecules 2017; 22(12):2169. doi: 10.3390/molecules22122169 [Crossref] [ Google Scholar]
- Correia A, Silva D, Correia A, Vilanova M, Gärtner F, Vale N. Study of new therapeutic strategies to combat breast cancer using drug combinations. Biomolecules 2018; 8(4):175. doi: 10.3390/biom8040175 [Crossref] [ Google Scholar]
- Gujral DM, Lloyd G, Bhattacharyya S. Effect of prophylactic betablocker or ACE inhibitor on cardiac dysfunction & heart failure during anthracycline chemotherapy ± trastuzumab. Breast 2018; 37:64-71. doi: 10.1016/j.breast.2017.10.010 [Crossref] [ Google Scholar]
- Swelum AA, El-Saadony MT, Abdo M, Ombarak RA, Hussein EOS, Suliman G. Nutritional, antimicrobial and medicinal properties of Camel’s milk: a review. Saudi J Biol Sci 2021; 28(5):3126-36. doi: 10.1016/j.sjbs.2021.02.057 [Crossref] [ Google Scholar]
- Krishnankutty R, Iskandarani A, Therachiyil L, Uddin S, Azizi F, Kulinski M. Anticancer activity of camel milk via induction of autophagic death in human colorectal and breast cancer cells. Asian Pac J Cancer Prev 2018; 19(12):3501-9. doi: 10.31557/apjcp.2018.19.12.3501 [Crossref] [ Google Scholar]
- Ayyash M, Al-Dhaheri AS, Al Mahadin S, Kizhakkayil J, Abushelaibi A. In vitro investigation of anticancer, antihypertensive, antidiabetic, and antioxidant activities of camel milk fermented with camel milk probiotic: a comparative study with fermented bovine milk. J Dairy Sci 2018; 101(2):900-11. doi: 10.3168/jds.2017-13400 [Crossref] [ Google Scholar]
- Alhaider AA, Abdel Gader AG, Almeshaal N, Saraswati S. Camel milk inhibits inflammatory angiogenesis via downregulation of proangiogenic and proinflammatory cytokines in mice. APMIS 2014; 122(7):599-607. doi: 10.1111/apm.12199 [Crossref] [ Google Scholar]
- Mati A, Senoussi-Ghezali C, Si Ahmed Zennia S, Almi-Sebbane D, El-Hatmi H, Girardet JM. Dromedary camel milk proteins, a source of peptides having biological activities-a review. Int Dairy J 2017; 73:25-37. doi: 10.1016/j.idairyj.2016.12.001 [Crossref] [ Google Scholar]
- Zibaee S, Hosseini SM, Yousefi M, Taghipour A, Kiani MA, Noras MR. Nutritional and therapeutic characteristics of camel milk in children: a systematic review. Electron Physician 2015; 7(7):1523-8. doi: 10.19082/1523 [Crossref] [ Google Scholar]
- Kamal H, Jafar S, Mudgil P, Murali C, Amin A, Maqsood S. Inhibitory properties of camel whey protein hydrolysates toward liver cancer cells, dipeptidyl peptidase-IV, and inflammation. J Dairy Sci 2018; 101(10):8711-20. doi: 10.3168/jds.2018-14586 [Crossref] [ Google Scholar]
- Ibrahim HR, Isono H, Miyata T. Potential antioxidant bioactive peptides from camel milk proteins. Anim Nutr 2018; 4(3):273-80. doi: 10.1016/j.aninu.2018.05.004 [Crossref] [ Google Scholar]
- Ibrahim HR, Miyawaki D, Miyata T. Ovotransferrin as a novel drug-targeting molecule for cancer chemotherapy. J Stem Cell Res Med 2020; 5:1-8. doi: 10.15761/jscrm.1000141 [Crossref] [ Google Scholar]
- Girardet JM, Saulnier F, Gaillard JL, Ramet JP, Humbert G. Camel (Camelus dromedarius) milk PP3: evidence for an insertion in the amino-terminal sequence of the camel milk whey protein. Biochem Cell Biol 2000; 78(1):19-26. doi: 10.1139/o99-067 [Crossref] [ Google Scholar]
- Ueno T, Azuma N, Motoshima H, Kanno C. Identification of polypeptides constituting lactophorin by monoclonal antibody to bovine milk lactophorin. Biosci Biotechnol Biochem 2005; 69(8):1459-65. doi: 10.1271/bbb.69.1459 [Crossref] [ Google Scholar]
- Yasmin I, Iqbal R, Liaqat A, Khan WA, Nadeem M, Iqbal A. Characterization and comparative evaluation of milk protein variants from Pakistani dairy breeds. Food Sci Anim Resour 2020; 40(5):689-98. doi: 10.5851/kosfa.2020.e44 [Crossref] [ Google Scholar]
- Kappeler S, Farah Z, Puhan Z. Alternative splicing of lactophorin mRNA from lactating mammary gland of the camel (Camelus dromedarius). J Dairy Sci 1999; 82(10):2084-93. doi: 10.3168/jds.S0022-0302(99)75450-0 [Crossref] [ Google Scholar]
- Hinz K, O’Connor PM, Huppertz T, Ross RP, Kelly AL. Comparison of the principal proteins in bovine, caprine, buffalo, equine and camel milk. J Dairy Res 2012; 79(2):185-91. doi: 10.1017/s0022029912000015 [Crossref] [ Google Scholar]
- Ryskaliyeva A, Henry C, Miranda G, Faye B, Konuspayeva G, Martin P. The main WAP isoform usually found in camel milk arises from the usage of an improbable intron cryptic splice site in the precursor to mRNA in which a GC-AG intron occurs. BMC Genet 2019; 20(1):14. doi: 10.1186/s12863-018-0704-x [Crossref] [ Google Scholar]
- Bastian ED, Brown RJ. Plasmin in milk and dairy products: an update. Int Dairy J 1996; 6(5):435-57. doi: 10.1016/0958-6946(95)00021-6 [Crossref] [ Google Scholar]
- Girardet JM, Linden G. PP3 component of bovine milk: a phosphorylated whey glycoprotein. J Dairy Res 1996; 63(2):333-50. doi: 10.1017/s0022029900031848 [Crossref] [ Google Scholar]
- Liu K, Liu PC, Liu R, Wu X. Dual AO/EB staining to detect apoptosis in osteosarcoma cells compared with flow cytometry. Med Sci Monit Basic Res 2015; 21:15-20. doi: 10.12659/msmbr.893327 [Crossref] [ Google Scholar]
- Redza-Dutordoir M, Averill-Bates DA. Activation of apoptosis signalling pathways by reactive oxygen species. Biochim Biophys Acta 2016; 1863(12):2977-92. doi: 10.1016/j.bbamcr.2016.09.012 [Crossref] [ Google Scholar]
- Greenwell M, Rahman PK. Medicinal plants: their use in anticancer treatment. Int J Pharm Sci Res 2015; 6(10):4103-12. doi: 10.13040/ijpsr.0975-8232.6(10).4103-12 [Crossref] [ Google Scholar]
- Gao J, Wang Z, Fu J, A J, Ohno Y, Xu C. Combination treatment with cisplatin, paclitaxel and olaparib has synergistic and dose reduction potential in ovarian cancer cells. Exp Ther Med 2021; 22(3):935. doi: 10.3892/etm.2021.10367 [Crossref] [ Google Scholar]
- El-Fakharany EM, El-Baky NA, Linjawi MH, Aljaddawi AA, Saleem TH, Nassar AY. Influence of camel milk on the hepatitis C virus burden of infected patients. Exp Ther Med 2017; 13(4):1313-20. doi: 10.3892/etm.2017.4159 [Crossref] [ Google Scholar]
- Korashy HM, Maayah ZH, Abd-Allah AR, El-Kadi AO, Alhaider AA. Camel milk triggers apoptotic signaling pathways in human hepatoma HepG2 and breast cancer MCF7 cell lines through transcriptional mechanism. J Biomed Biotechnol 2012; 2012:593195. doi: 10.1155/2012/593195 [Crossref] [ Google Scholar]
- Korashy HM, El Gendy MA, Alhaider AA, El-Kadi AO. Camel milk modulates the expression of aryl hydrocarbon receptor-regulated genes, Cyp1a1, Nqo1, and Gsta1, in murine hepatoma Hepa 1c1c7 cells. J Biomed Biotechnol 2012; 2012:782642. doi: 10.1155/2012/782642 [Crossref] [ Google Scholar]
- Habib HM, Ibrahim WH, Schneider-Stock R, Hassan HM. Camel milk lactoferrin reduces the proliferation of colorectal cancer cells and exerts antioxidant and DNA damage inhibitory activities. Food Chem 2013; 141(1):148-52. doi: 10.1016/j.foodchem.2013.03.039 [Crossref] [ Google Scholar]
- Uversky VN, El-Fakharany EM, Abu-Serie MM, Almehdar HA, Redwan EM. Divergent anticancer activity of free and formulated camel milk α-lactalbumin. Cancer Invest 2017; 35(9):610-23. doi: 10.1080/07357907.2017.1373783 [Crossref] [ Google Scholar]
- Shori AB. Camel milk as a potential therapy for controlling diabetes and its complications: a review of in vivo studies. J Food Drug Anal 2015; 23(4):609-18. doi: 10.1016/j.jfda.2015.02.007 [Crossref] [ Google Scholar]
- Sørensen ES, Petersen TE. Phosphorylation, glycosylation and amino acid sequence of component PP3 from the proteose peptone fraction of bovine milk. J Dairy Res 1993; 60(4):535-42. doi: 10.1017/s0022029900027886 [Crossref] [ Google Scholar]
- Kanno C, Ogawa H. Proteolytic degradation of lactophorin from bovine milk by plasmin and trypsin. Jpn J Zootech Sci 1989; 60(9):865-73. [ Google Scholar]
- El-Salam MHA, El-Shibiny S. Bioactive peptides of buffalo, camel, goat, sheep, mare, and yak milks and milk products. Food Rev Int 2013; 29(1):1-23. doi: 10.1080/87559129.2012.692137 [Crossref] [ Google Scholar]
- Mohamed H, Johansson M, Lundh Å, Nagy P, Kamal-Eldin A. Short communication: caseins and α-lactalbumin content of camel milk (Camelus dromedarius) determined by capillary electrophoresis. J Dairy Sci 2020; 103(12):11094-9. doi: 10.3168/jds.2020-19122 [Crossref] [ Google Scholar]
- Barbana C, Sánchez L, Pérez MD. Bioactivity of α-lactalbumin related to its interaction with fatty acids: a review. Crit Rev Food Sci Nutr 2011; 51(8):783-94. doi: 10.1080/10408398.2010.481368 [Crossref] [ Google Scholar]