Avicenna Journal of Medical Biochemistry. 10(1):58-64.
doi: 10.34172/ajmb.2022.08
Original Article
Exogenous Nitric Oxide Up-regulates the Runx2 Via Bmp7 Overexpression to Increase the Osteoblast Matrix Production In Vitro
Mohammad Hussein Abnos *  , Javad Sargolzaei , Mahsa Maleklou
Author information:
Department of Biology, Faculty of Sciences, Arak University, Arak, Iran
*
Corresponding author: Abnosi Mohammad Hussein, Address: P.O.Box: 38156-8- 8349, Department of Biology, Faculty of Sciences, Arak University, Arak, Iran. Tel:+989189630568, Email:
m-abnosi@araku.ac.ir
Abstract
Background: Nitric oxide (NO) is a signaling molecule that is required for the osteogenic differentiation of bone marrow mesenchymal stem cells (BMSCs). According to previous reports, high concentrations of sodium nitroprusside (SNP) inhibit the osteogenic differentiation of BMSCs, while its low concentration promotes this process.
Objectives: The present investigation focused on evaluating the underlying mechanism of the osteogenic differentiation of BMSCs treated with low concentrations of SNP as an NO generating agent.
Methods: The BMSCs after the 3rd passage was differentiated to osteoblasts when treated with 100 µM for 1 hour every 48 hours until 5, 10, 15, and 20 days of incubation. Then, the matrix production was estimated by quantitative alizarin red assay and calcium determination. The expression of different genes involved in osteogenic differentiation was statistically determined using the reverse transcriptase polymerase chain reaction. Finally, alkaline phosphatase activity was measured by a commercial kit.
Results: The exogenous NO caused a significant (P<0.05) increase in the matrix production of differentiated BMSCs from day 5 to 20. The results showed the elevation of alkaline phosphatase activity and the up-regulation of its gene. Eventually, an increase was observed in the expression of a cascade of other genes such as osteonectin, Bmp7, Smad1, Runx2, and Raf1 in treated BMSCs.
Conclusion: Overall, short-time treatment with a low concentration of exogenous NO increases the matrix production via gene up-regulation and protein production, which might open a new window in treating the low-density bone complication.
Keywords: Mesenchymal stem cell, Cell differentiation, Nitric oxide, Gene expression, Calcium,
Copyright and License Information
© 2022 The Author(s); Published by Hamadan University of Medical Sciences.
This is an open-access article distributed under the terms of the Creative Commons Attribution License (
http://creativecommons.org/licenses/by/4.0), which permits unrestricted use, distribution, and reproduction in any medium provided the original work is properly cited.
Please cite this article as follows: Abnos MH, Sargolzaei J, Maleklou M. Exogenous nitric oxide up-regulates the runx2 via bmp7 overexpression to increase the osteoblast matrix production in vitro. Avicenna J Med Biochem. 2022; 10(1):58-64. doi:10.34172/ajmb.2022.08
Background
Three isoenzymes of nitric oxide (NO) synthase, namely, inducible NO synthase, epithelial NO synthase, and neural NO synthase (1) produce NO from arginine (2,3) and the first two are found in the osteoblasts (4). At the physiological level, NO causes the expression of the genes involved in the growth of the bone (5) and the maturation of osteoblasts (6) whereas the excess of NO causes cell cytotoxicity and induces apoptosis in a variety of cells such as mesenchymal stem cells (7), neurons (8), hepatocyte (9), and human sperm (10). The mesenchymal stem cell differentiates to osteoblast that plays a critical role in the prevention of osteoporosis and bone repair and remodeling (11). In the osteogenic differentiation of the mesenchymal stem cells, the expression of many genes (e.g., RUNX2, OSTRIX, SMADs, and BMPs) has to be regulated (12) that are directly or indirectly influenced by NO (13).
At low concentrations, NO is beneficial to the cell, but its high concentration has been considered to cause cell toxicity, which is a matter of concern (14,15). Considering that NO has been prescribed to control complications such as hypertension, exogenous NO might be helpful in the treatment of osteoporosis or other bone-related complications. Many chemical agents such as sodium nitroprusside (SNP), S-NITROSO-N-ACETYLCYSTEINE, NO-aspirin, S-nitrosothiols, and the like are known to generate NO in vivo and in vitro (16). These chemicals have been used to investigate the effect of exogenous NO on the cellular mechanism such as the osteogenic differentiation of mesenchymal stem cells (17,18). Felka et al studied the inhibitory effect of exogenous NO released by SNP on the osteogenic differentiation of human mesenchymal stem cells and found that the high concentration of NO inhibited RUNX2 expression (19). In contrast, Abnosi and Pari revealed that the pre-treatment of the rat bone marrow mesenchymal stem cells (BMSCs) with 100 µM of SNP for 1 hour every 48 hours elevated matrix formation from day 10 of the differentiation process up to the 20th day of incubation (20).
Based on the previous report, the continuous exposure of BMSCs to low concentrations of NO might have beneficial effects. Therefore, the present study investigated the effect of continuously exposed MSCs to low concentrations of SNP as a NO liberating agent on the matrix formation, alkaline phosphatase (ALP) activity, and the expression of genes involved in the osteogenic differentiation of these cells in vitro.
Materials and Methods
BMSC Extraction
To conduct the excremental investigation, male Wistar rats (6-8 weeks) were purchased from Pasteur Institute of Iran (Tehran) and housed in a polyethylene cage at 27 ± 3°C with enough access to food and water. Based on the protocol approved by Arak University, the rats were anesthetized with the inhalation of chloroform in the airtight jar and then sacrificed. Next, the bones (tibias and femurs) were surgically removed, and the soft tissues were removed under sterile conditions. The ends of the bones were cut, and the bone marrow was extracted in 2 mL Dulbecco Modified Eagle’s medium (DMEM, Gibco, Germany) supplemented with 15% of fetal bovine serum (FBS, Gibco, Germany) and penicillin/streptomycin (Gibco, Germany). The extracted bone marrow was precipitated at 2500 rpm for 5 minutes, then suspended in a T25 culture flask containing 5 mL DMEM and incubated at 37°C under 5% CO2 in an appropriated culture flask. The culture media were replaced twice a week until the bottom of the flask was covered with the cell. The cells were trypsinized (trypsin- Ethylenediaminetetraacetic acid; Gibco, Germany), and subcultured in fresh media after it was washed with phosphate saline buffer. The subculture was expanded for several passages to find the best generation and purity for further analysis using the flow cytometer (Germany, PARTEC; PAS).
Osteogenic Induction and Exposure to SNP
The stock solution of SNP was prepared in deionized water, and the pH was adjusted to 7.2. The BMSCs (5 × 10⁴) after the 3rd passage were seeded in 6-well culture plates and allowed to cover the bottom of the plate up to 70%, and then cultured in osteogenic media containing DMEM, 15% (v/v) FBS, 1 % (v/v) streptomycin- penicillin (10 mL/L), 1 mM sodium glycerophosphate, 50 μg/mL L-ascorbate, and 10-8 M dexamethasone. The treatment was conducted with 100 μM of SNP (Merck, Germany) for 1 hour every 48 hours until 5, 10, 15, and 21 days of the incubation period in the presence of control groups. The analysis was repeated three times for each experiment.
Investigation of Mineralization
The plates were washed and fixed with formaldehyde (10% v/v, Sigma-Aldrich) for 10 minutes, then 1 mL of the alizarin red solution (40 mM, pH = 4.1) was added and kept at room temperature for 10 minutes. The excess dye was removed and washed with dH2O, and then the stained cells were observed and photographed by a camera-equipped, inverted microscope. The cells were incubated at room temperature for 30 minutes, along with 800 µL of acetic acid (10%). Next, the cells were removed using a scraper and transferred to a 1.5 mL micro-centrifuge tube. The slurry was vortexed for 30 seconds, and 500 µL of the mineral oil (Sigma-Aldrich) was placed on it and kept in a water bath (85°C) for 10 minutes, followed by 5 minutes of incubation on ice. The extract was centrifuged for 15 minutes at 13000 rpm, and the supernatant was transferred to another micro-centrifuge tube and neutralized with 200 µL of ammonium hydroxide (10%). Subsequently, the absorption of 100 µL neutralized supernatant was measured at 450 nm in an ELISA reader, and then the concentration of alizarin red was calculated using the linear formula Y = 0.168X + 0.112 with R2 = 0.997 where Y and X stand for the absorbance and concentration (µM) of alizarin red, respectively. The alizarin red standard graph was also prepared by diluting the alizarin red solution with the acetic acid solution (10%) and the ammonium solution (10%) in a ratio of 5:2. A series of diluted standard solutions from 31.3 to 2000 µM was prepared, then the absorption was measured at 450 nm using an ELISA reader.
Matrix Calcium Estimation
The plate was washed, and the cells were detached from the plate and transferred to a known weight micro-centrifuge tube using a scraper. Next, the weight of the samples was calculated by subtracting the weight of empty tubes and the weight of the tube containing the sample. The samples were treated with 50 μL of 0.5 N HCl for 24 hours and centrifuged for 10 minutes at 10 000 rpm, and then the total calcium of the extract was measured using a commercial kit (Quantitative analysis of calcium: photometric method, Pars Azmoon Company, Iran) where theoretically calcium in neutral pH reacts with arsenazo, and the intensity of the produced blue color is proportional to its concentration after 5 minutes. Using different concentrations of CaCl2, the standard graph was plotted, and the unknown sample concentrations were determined by the linear formula Y = 0.005X-0.0009 with R2 = 0.998 (Y and X denote absorption and concentration of calcium, respectively). A spectrophotometer (T80 + PG Instrument Manufacturing Company, UK) was used to measure the absorption at 630 nm, and the calcium concentration was reported as mg/dL.
Cell Extract Preparation
After treatment, the cells were washed and scraped from the bottom of the flasks using Tris-HCl buffer (pH = 7.4). The scraped cell was collected in a micro-tube, and then the content of the cells was released using freezing and thawing and centrifugation for 10 minutes at 12 000 g. To estimate the total protein content of the samples, the Lowry method was employed, and the same method was applied to plot a standard graph using bovine serum albumin as standard protein. To calculate the concentration of protein in the unknown samples, the linear formula Y = 00021X + 0.0575 with R2 = 0.9966 was used, where Yand X represent absorbance and concentration (μg) of protein, respectively.
Estimation of ALP Activity
The ALP activity of the extracted samples was estimated based on the equal amount of protein using a commercial kit (Quantitative analysis of ALP: photometric method, Pars Azmoon Company, Iran). According to the instruction, the enzyme acts on p-nitrophenyl phosphate to release phosphate and p-nitrophenolate where the intensity of the developed color is proportional to the activity of ALP. The absorbance was measured at 410 nm using a spectrophotometer (T80 + PG Instrument, Ltd., England).
Gene Expression Analysis
Following total RNA extraction, the gene expression was analyzed by a semi-quantitative reverse transcription polymerase chain reaction (RT-PCR) using the Super RNA extraction kit (YT9080). The concentration of total RNA was determined using a spectrophotometer (T80 + PG Instrument Manufacturing Company, UK), and the cDNA was synthesized according to the instruction given in the BioFACT commercial kit (BR631-096). Thermo Cycler (Eppendorf master cycler gradient) was employed to perform the PCR of ALP, glyceraldehyde dehydrogenase (GAPDH was taken as a housekeeping gene for internal control), SMAD1, osteonectin, Raf1, osteocalcin, BMP7, and Runt-related transcription factor 2 (RUNX2) genes with the following programmed using specific primers (Table 1):
Table 1.
Primers Properties
|
Gene
|
Primers
|
Annealing Temperature
|
Product Length
|
Reference
|
|
Alp
|
F: CATGTTTCCTGGGAGATGGTA
R: GTGTTGTACGTCTTGGAGAGA |
58.4
59.4 |
144 bp |
21 |
|
Oc
|
F: AACGGTGGTGCCATAGATGC
R: AGGAGGCTCTCTCTGCTCAC |
60.5
62.5 |
294 bp |
21 |
|
Runx2
|
F: CCGCACGACAACCGCACCAT
R: CGCTCCGGCCCACAAATCTC |
64.6
64.6 |
289 bp |
21 |
|
Raf1
|
F: ATGTGCGGAATGGGATGAG
R: TCGGTGTTCCAATCTAAGCG |
54.4
58.4 |
139 bp |
22 |
| Smad1 |
F: CCGCCTGCTTACCTGCCTCCTGAA
R: GAACGCTTCGCCCACACGGTTGT |
70.4
68.2 |
246 bp |
21 |
|
Bmp7
|
F: AAGCCCAGATGGTACGG
R: GCACCTCCAGGGAAAAC |
54.8
54.8 |
443 bp |
21 |
|
Gapdh
|
F: TCGTCTCATAGACAAGATGG
R: GTAGTTGAGGTCAATGAAGGG |
56.4
59.4 |
136 bp |
21 |
First, 95°C for 5 minutes and 95°C for 1 minute as denaturation temperature, followed by the annealing temperature of the specific primer (Table 1) for 1 minute. The extension temperature was 72°C for 1 minute, and finally, 72°C for 7 minutes was applied as elongation temperature. The above cycle was repeated 40 times, and the agarose gel electrophoresis was used to run the PCR product. The analysis was performed three times, and the intensity of the bands was determined by Gel Quant software (1.8.2). The data were analyzed by statistical software, and the results were presented as means ± standard deviations (SD).
Analysis of Data
One-way analysis of variance (ANOVA) and Tukey’s tests were applied to analyze data by SPSS software (version 20). Data were presented as the mean ( ± SD), and the P < 0.05 was taken as the minimum level of significance.
Results
Estimation of Matrix Formation Based on Alizarin Red Assay
Alizarin red estimation showed that the matrix formation has started from day 10 and reached its maximum on day 20 in the control group, whereas it was observed to be started from day 5 in the treated group. In the treated group, statistical analysis revealed that the matrix formation was significantly increased (P < 0.05) due to exogenous NO released by SNP when compared to the control group (Table 2). The microscopic analysis also confirmed the elevation of matrix formation during the incubation period from day 5 to day 20 (Figure 1) in the treated group.
Table 2.
The Mean Concentration of Alizarin Red (µM) Extracted From Control and Treated BMSCs After the Completion of the Incubation Period (5, 10, 15, and 20 Days)
|
|
5 Days
|
10 Days
|
15 Days
|
20 Days
|
| Control |
0.94a ± 0.01 |
2.10a ± 0.18 |
3.10a ± 0.10 |
4.60a ± 0.02 |
| 100 (µM) |
1.81b ± 0.05 |
3.90b ± 0.08 |
4.40b ± 0.05 |
5.17b ± 0.05 |
Note. BMSC: Bone marrow mesenchymal stem cell. Values are shown as means ± standard deviations. In each column, the means with a different letter code denotes significant differences compared with the control group (Analysis of variance, Tukey’s test, P< 0.05).
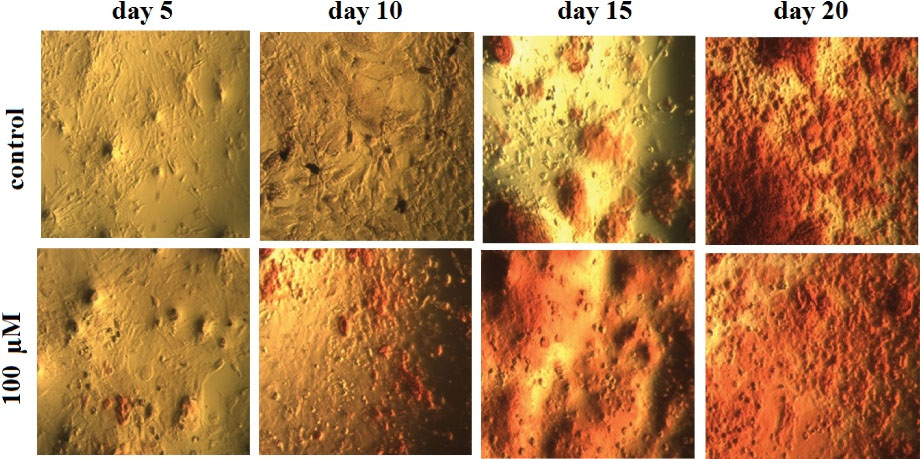
Figure 1.
The Image of the Osteogenic Differentiated Cells Where the Differentiation Has Started From Day 5 in the Treated Group of the Cell When Compared to the Control One. Note. SNP: Sodium nitroprusside. The matrix deposition under the influence of SNP was observed to be significant (Magnification 20X).
.
The Image of the Osteogenic Differentiated Cells Where the Differentiation Has Started From Day 5 in the Treated Group of the Cell When Compared to the Control One. Note. SNP: Sodium nitroprusside. The matrix deposition under the influence of SNP was observed to be significant (Magnification 20X).
Estimation of Calcium
The statistical analysis of the calcium concentration extracted from the matrix of the differentiated cells demonstrated that the exogenous NO released by SNP significantly (P < 0.05) increased the deposited calcium (Table 3). It was also observed that the calcium deposition increased from day 5 as compared with the control group, and this elevation in calcium deposition continued until the end of incubation on day 20.
Table 3.
The Mean Concentration of Calcium (mg dL-1) Extracted From the Matrix of Control and Treated BMSCs After the Completion of the Incubation Period (5, 10, 15, and 20 Days)
|
|
5 Days
|
10 Days
|
15 Days
|
20 Days
|
| Control |
2.80a ± 0.08 |
17.58a ± 0.21 |
26.08a ± 0.12 |
29.47a ± 0.21 |
| 100 (µM) |
4.75b ± 0.17 |
18.09b ± 0.12 |
28.81b ± 0.26 |
31.04b ± 0.12 |
Note. BMSC: Bone marrow mesenchymal stem cell. Values are indicated as means ± standard deviations. In each column, the means with a different letter code implies differences which are significant compared to the control group (Analysis of variance, Tukey’s test, P < 0.05).
Estimation of Total Protein Concentration and ALP Activity
Based on the findings, the treatment of the cell with exogenous NO significantly increased (P < 0.05) the total protein from day 5 until day 20 when compared with the control group (Table 4). This increase was observed to be in comparison to each control group at its specific incubation time. It was noticed that the increase in the total protein content of the cell was highly significant (P < 0.001) from the 10th day of the treatment.
Table 4.
The Mean Concentration (µg) of Total Protein and Alkaline Phosphatase Activity (IU L-1) Extracted From the Matrix of Control and Treated BMSCs After the Completion of the Incubation period (5, 10, 15, and 20 Days)
|
|
Incubation Period (day)
|
Control
|
100 µM
|
| Total protein concentration |
5 |
11.33a ± 0.14 |
14.66b ± 0.14 |
| 10 |
21.42a ± 0.71 |
32.49b ± 0.35 |
| 15 |
32.49a ± 0.35 |
41.30b ± 0.59 |
| 20 |
35.95a ± 0.95 |
44.04b ± 1.70 |
| Alkaline phosphatase activity |
5 |
189.52a ± 3.43 |
374.16b ± 5.61 |
| 10 |
346.82a ± 2.01 |
479.66b ± 4.72 |
| 15 |
543.10a ± 4.95 |
806.85b ± 4.26 |
| 20 |
726.91a ± 1.34 |
992.78b ± 3.46 |
Note. BMSC: Bone marrow mesenchymal stem cell. Values are demonstrated as means ± standard deviations. In each row, the means with a different letter code shows significant differences in comparison to the control group (Analysis of variance, Tukey’s test, P < 0.05).
In addition, the results represented that there was a highly significant increase in the activity of ALP (P < 0.001) on day 5 when compared with the control group (Table 4). The continuous increase in enzyme activity was observed to rise sharply until day 20.
Expression of the Genes Involved in Osteogenic Differentiation
The statistical analysis of RT-PCR data indicated that the expression of ALP, osteocalcin (Oc), Runx2, Raf1, Smad1, and Bmp7 was significantly (P < 0.05) up-regulated, while no significant (P > 0.05) changes were observed regarding the expression of Gapdh (Table 5). Figure 2 confirms the statistical results.
Table 5.
The Mean Expression of the Genes Involved in the Osteogenic Differentiation of BMSCs after 20 Days of the Incubation period
|
|
Control
|
100 µM
|
|
Alp
|
0.74a ± 0.03 |
1.06b ± 0.08 |
| Osteocalcin (Oc) |
0.81a ± 0.05 |
1.10b ± 0.10 |
|
Runx2
|
0.86a ± 0.03 |
0.95b ± 0.03 |
|
Raf1
|
0.59a ± 0.01 |
0.69b ± 0.04 |
|
Smad1
|
0.74a ± 0.01 |
0.86b ± 0.02 |
|
Bmp7
|
0.63a ± 0.02 |
0.74b ± 0.01 |
|
Gapdh
|
0.98a ± 0.01 |
0.98a ± 0.00 |
Note. BMSC: Bone marrow mesenchymal stem cell. Values are shown as means ± standard deviations. In each row, the means with a different letter code represents significant differences compared to the control group (Analysis of variance, Tukey’s test, P < 0.05).
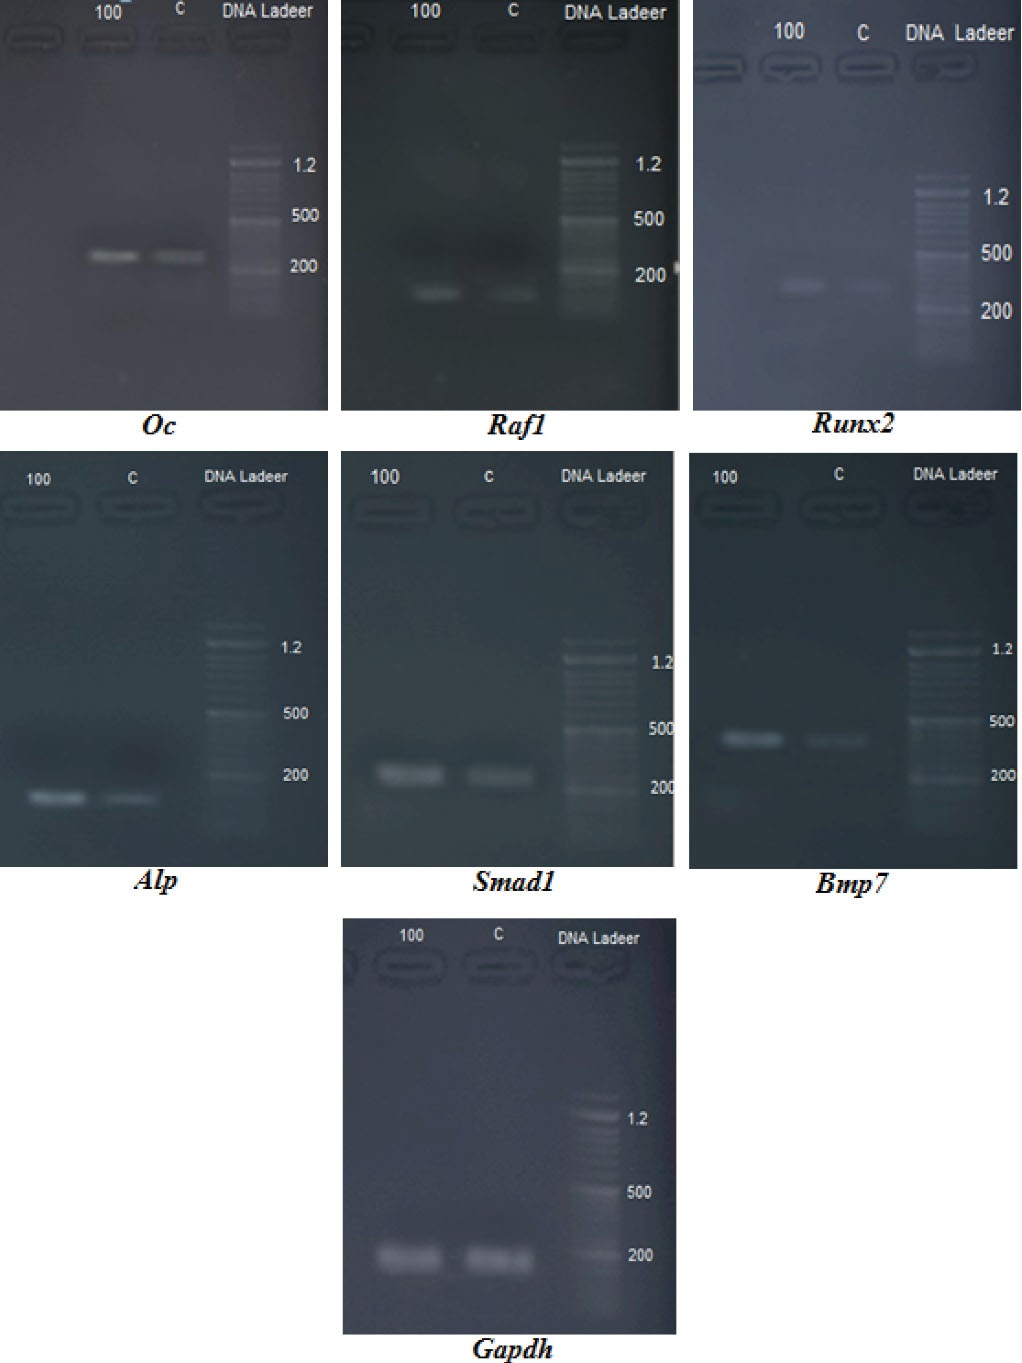
Figure 2.
The Image From the Agarose Gel of the Genes Involved in the Osteogenic Differentiation of Bone Marrow Mesenchymal Stem Cells.
.
The Image From the Agarose Gel of the Genes Involved in the Osteogenic Differentiation of Bone Marrow Mesenchymal Stem Cells.
Discussion
Felka et al reported the osteogenic inhibitory effect of exogenous NO at high concentrations (1 mM) in the early stage of osteogenesis, but in our previous study, we showed that the 100 µM of SNP as the NO-releasing agent induced the early matrix formation of BMSCs at day 5 in vitro (19,20). Some studies reported that the matrix formation starts from day 7 when the activity of ALP begins as an early gene (23,24). From the beginning of osteogenic induction, the Bmp(s) play an important role in starting the intracellular cascade, causing the up-regulation of the Smad (s) gene that induces the expression of Runx2, finally leading to the up-regulation of osteonectin, osteocalcin, and ALP via Osterix gene expression (25). In the BMP family, the BMP7 is the main protein that activates the osteogenic cascade (26) by the activation of SMAD1 as a primary effector (27). The expression of Alp takes place in the early stage of the osteogenic differentiation (23), followed by the up-regulation of osteocalcin (Oc ), osteonectin (On), and collagen I (Coll 1) which are necessary for matrix formation (21). To understand the mechanism of the NO effects on the osteogenic differentiation of BMSCs, the present study focused on determining the total protein and the activity of ALP, where it was revealed that the exogenous NO released by SNP induced and increased the total protein content of BMSCs, finally, elevated ALP activity. The elevation of the protein level was reported by other investigators with respect to collagen and other proteins required for bone matrix formation (28-30). In another study, the elevation of ALP activity was highlighted as the necessary equipment to deposit hydroxyapatite crystals (31).
In addition to the protein level, our findings revealed that the NO released by SNP induces the up-regulation of several genes involved in the osteogenic induction. The regulation of genes starts from Bmp7 and continues with Smad1 to elevate the expression of Runx2, finally up-regulating the expression of Oc and Alp genes (Figure 3). It was further found that NO released by SNP caused the activation of the MAPK gene related expression (data are not available), which may activate the expression of the Runx2 gene (32,33) as well.
Based on the results of this study and other investigations (20,34), it can be concluded that the exogenous NO might increase bone matrix formation by influencing the protein and gene expression of differentiated BMSCs and inducing early matrix formation in derived preosteoblasts. In our investigation, the effects of exogenous NO were started as early as the treatment began, from day 5 when the level of the total protein represented a significant increase. Proteins such as collagen I (35,36) are primarily required for the deposition of hydroxyapatite in the matrix. Therefore, the elevation of the protein level, along with the up-regulation of osteogenic-related genes worked together to raise the production of the bone matrix where the alizarin red analysis and calcium measurement confirmed it.
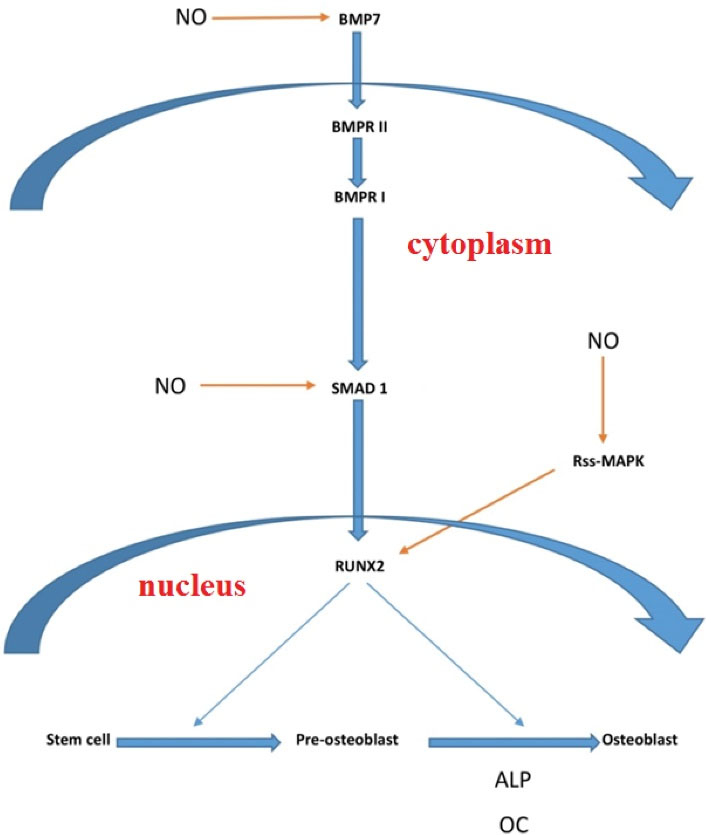
Figure 3.
The Pathway of NO Release by SNP Affects the Expression of Genes involved in Osteogenic Induction of BMSCs In Vitro. Note. NO: Nitric oxide; SNP: Sodium nitroprusside; BMSC: Bone marrow mesenchymal stem cell.
.
The Pathway of NO Release by SNP Affects the Expression of Genes involved in Osteogenic Induction of BMSCs In Vitro. Note. NO: Nitric oxide; SNP: Sodium nitroprusside; BMSC: Bone marrow mesenchymal stem cell.
Conclusion
In conclusion, it was found that the short-time exposure of BMSCs to low concentrations of exogenous NO would cause early osteogenic differentiation and mineralization through the elevation of protein production and the up-regulation of related genes. Accordingly, it is strongly recommended that more investigations be conducted to find out if the exogenous treatment with the NO-releasing agent could probably help compensate for low-density bone-related complications.
Acknowledgments
This project was performed in the Department of Biology, Arak University, as a M.Sc. research program; therefore, we wish to cordially acknowledge the authorities who granted this research work.
Authors’ Contribution
Abnosi MH: Conceived of the study idea and were in charge of overall direction and planning, designed the experiments and wrote the manuscript. Sargolzaei J: carried out experiment and designed the primer. Maleklou M: carried out the experiments and analyzed the data.
Conflict of Interests
The authors declare that they have no conflict of interests.
Ethical Issues
The study was approved by Arak Medical University ethics committee, Iran, and the approval number is IR.ARAKMU.REC.1397.110.
Funding/Support
The project was implemented with personal expenses and received no funding.
References
- Wimalawansa SJ. Nitric oxide: novel therapy for osteoporosis. Expert Opin Pharmacother 2008; 9(17):3025-44. doi: 10.1517/14656560802197162 [Crossref] [ Google Scholar]
- Förstermann U, Sessa WC. Nitric oxide synthases: regulation and function. Eur Heart J 2012; 33(7):829-37. doi: 10.1093/eurheartj/ehr304 [Crossref] [ Google Scholar]
- Hill BG, Dranka BP, Bailey SM, Lancaster JR Jr, Darley-Usmar VM. What part of NO don’t you understand? Some answers to the cardinal questions in nitric oxide biology. J Biol Chem 2010; 285(26):19699-704. doi: 10.1074/jbc.R110.101618 [Crossref] [ Google Scholar]
- Cuzzocrea S, Mazzon E, Dugo L, Genovese T, Di Paola R, Ruggeri Z. Inducible nitric oxide synthase mediates bone loss in ovariectomized mice. Endocrinology 2003; 144(3):1098-107. doi: 10.1210/en.2002-220597 [Crossref] [ Google Scholar]
- van’t Hof RJ, Macphee J, Libouban H, Helfrich MH, Ralston SH. Regulation of bone mass and bone turnover by neuronal nitric oxide synthase. Endocrinology 2004; 145(11):5068-74. doi: 10.1210/en.2004-0205 [Crossref] [ Google Scholar]
- Nascimento MH, Pelegrino MT, Pieretti JC, Seabra AB. How can nitric oxide help osteogenesis?. AIMS Mol Sci 2020; 7(1):29-48. doi: 10.3934/molsci.2020003 [Crossref] [ Google Scholar]
- Pari S, Abnosi MH, Pakyari R. Sodium nitroprusside changed the metabolism of mesenchymal stem cells to an anaerobic state while viability and proliferation remained intact. Cell J 2017; 19(1):146-58. doi: 10.22074/cellj.2016.4875 [Crossref] [ Google Scholar]
- Picón-Pagès P, Garcia-Buendia J, Muñoz FJ. Functions and dysfunctions of nitric oxide in brain. Biochim Biophys Acta Mol Basis Dis 2019; 1865(8):1949-67. doi: 10.1016/j.bbadis.2018.11.007 [Crossref] [ Google Scholar]
- Iwakiri Y, Kim MY. Nitric oxide in liver diseases. Trends Pharmacol Sci 2015; 36(8):524-36. doi: 10.1016/j.tips.2015.05.001 [Crossref] [ Google Scholar]
- Wu TP, Huang BM, Tsai HC, Lui MC, Liu MY. Effects of nitric oxide on human spermatozoa activity, fertilization and mouse embryonic development. Arch Androl 2004; 50(3):173-9. doi: 10.1080/01485010490425494 [Crossref] [ Google Scholar]
- Phetfong J, Sanvoranart T, Nartprayut K, Nimsanor N, Seenprachawong K, Prachayasittikul V. Osteoporosis: the current status of mesenchymal stem cell-based therapy. Cell Mol Biol Lett 2016; 21:12. doi: 10.1186/s11658-016-0013-1 [Crossref] [ Google Scholar]
- Han L, Wang B, Wang R, Gong S, Chen G, Xu W. The shift in the balance between osteoblastogenesis and adipogenesis of mesenchymal stem cells mediated by glucocorticoid receptor. Stem Cell Res Ther 2019; 10(1):377. doi: 10.1186/s13287-019-1498-0 [Crossref] [ Google Scholar]
- Lee JS, Lee HJ, Lee JW, Lee SC, Heo JS. Osteogenic effect of inducible nitric oxide synthase (iNOS)-loaded mineralized nanoparticles on embryonic stem cells. Cell Physiol Biochem 2018; 51(2):746-62. doi: 10.1159/000495330 [Crossref] [ Google Scholar]
- Ho WP, Chen TL, Chiu WT, Tai YT, Chen RM. Nitric oxide induces osteoblast apoptosis through a mitochondria-dependent pathway. Ann N Y Acad Sci 2005; 1042:460-70. doi: 10.1196/annals.1338.039 [Crossref] [ Google Scholar]
- Saura M, Tarin C, Zaragoza C. Recent insights into the implication of nitric oxide in osteoblast differentiation and proliferation during bone development. ScientificWorldJournal 2010; 10:624-32. doi: 10.1100/tsw.2010.58 [Crossref] [ Google Scholar]
- Napoli C, Ignarro LJ. Nitric oxide-releasing drugs. Annu Rev Pharmacol Toxicol 2003; 43:97-123. doi: 10.1146/annurev.pharmtox.43.100901.140226 [Crossref] [ Google Scholar]
- Mohammadi A, Abnosi MH, Pakyari R. Low concentration of sodium nitroprusside promotes mesenchymal stem cell viability and proliferation through elevation of metabolic activity. Avicenna J Med Biochem 2017; 5(1):9-16. doi: 10.15171/ajmb.2017.02 [Crossref] [ Google Scholar]
- Xing Q, Yates K, Bailey A, Vogt C, He W, Frost MC. Effects of local nitric oxide release on human mesenchymal stem cell attachment and proliferation on gelatin hydrogel surface. Surf Innov 2013; 1(4):224-32. doi: 10.1680/si.13.00019 [Crossref] [ Google Scholar]
- Felka T, Ulrich C, Rolauffs B, Mittag F, Kluba T, DeZwart P. Nitric oxide activates signaling by c- Raf, MEK, p-JNK, p38 MAPK and p53 in human mesenchymal stromal cells and inhibits their osteogenic differentiation by locking expression of Runx2. Stem Cell Res Ther 2014; 4(4):195. doi: 10.4172/2157-7633.1000195 [Crossref] [ Google Scholar]
- Abnosi MH, Pari S. Exogenous nitric oxide induced early mineralization in rat bone marrow mesenchymal stem cells via activation of alkaline phosphatase. Iran Biomed J 2019; 23(2):142-52. doi: 10.29252/.23.2.142 [Crossref] [ Google Scholar]
- Abnosi MH, Masoomi S. p-Nonylphenol impairment of osteogenic differentiation of mesenchymal stem cells was found to be due to oxidative stress and down-regulation of RUNX2 and BMP. Endocr Metab Immune Disord Drug Targets 2020; 20(8):1336-46. doi: 10.2174/1871530320666200505114058 [Crossref] [ Google Scholar]
- Song J, Ye B, Liu H, Bi R, Zhang N, Hu J. Fak-Mapk, Hippo and Wnt signalling pathway expression and regulation in distraction osteogenesis. Cell Prolif 2018; 51(4):e12453. doi: 10.1111/cpr.12453 [Crossref] [ Google Scholar]
- Taghiyar L, Hosseini S, Hesaraki M, Azam Sayahpour F, Aghdami N, Baghaban Eslaminejad M. Isolation, characterization and osteogenic potential of mouse digit tip blastema cells in comparison with bone marrow-derived mesenchymal stem cells in vitro. Cell J 2018; 19(4):585-98. doi: 10.22074/cellj.2018.4710 [Crossref] [ Google Scholar]
- Movahedi Najafabadi BA, Abnosi MH. Boron induces early matrix mineralization via calcium deposition and elevation of alkaline phosphatase activity in differentiated rat bone marrow mesenchymal stem cells. Cell J 2016; 18(1):62-73. doi: 10.22074/cellj.2016.3988 [Crossref] [ Google Scholar]
- Qi H, Aguiar DJ, Williams SM, La Pean A, Pan W, Verfaillie CM. Identification of genes responsible for osteoblast differentiation from human mesodermal progenitor cells. Proc Natl Acad Sci U S A 2003; 100(6):3305-10. doi: 10.1073/pnas.0532693100 [Crossref] [ Google Scholar]
- Shen B, Wei A, Whittaker S, Williams LA, Tao H, Ma DD. The role of BMP-7 in chondrogenic and osteogenic differentiation of human bone marrow multipotent mesenchymal stromal cells in vitro. J Cell Biochem 2010; 109(2):406-16. doi: 10.1002/jcb.22412 [Crossref] [ Google Scholar]
- Beederman M, Lamplot JD, Nan G, Wang J, Liu X, Yin L. BMP signaling in mesenchymal stem cell differentiation and bone formation. J Biomed Sci Eng 2013; 6(8A):32-52. doi: 10.4236/jbise.2013.68A1004 [Crossref] [ Google Scholar]
- Akhir HM, Teoh PL. Collagen type I promotes osteogenic differentiation of amniotic membrane-derived mesenchymal stromal cells in basal and induction media. Biosci Rep 2020; 40(12):BSR20201325. doi: 10.1042/bsr20201325 [Crossref] [ Google Scholar]
- Jin YR, Stohn JP, Wang Q, Nagano K, Baron R, Bouxsein ML. Inhibition of osteoclast differentiation and collagen antibody-induced arthritis by CTHRC1. Bone 2017; 97:153-67. doi: 10.1016/j.bone.2017.01.022 [Crossref] [ Google Scholar]
- Nowwarote N, Osathanon T, Jitjaturunt P, Manopattanasoontorn S, Pavasant P. Asiaticoside induces type I collagen synthesis and osteogenic differentiation in human periodontal ligament cells. Phytother Res 2013; 27(3):457-62. doi: 10.1002/ptr.4742 [Crossref] [ Google Scholar]
- Orimo H. The mechanism of mineralization and the role of alkaline phosphatase in health and disease. J Nippon Med Sch 2010; 77(1):4-12. doi: 10.1272/jnms.77.4 [Crossref] [ Google Scholar]
- Ge C, Xiao G, Jiang D, Yang Q, Hatch NE, Roca H. Identification and functional characterization of ERK/MAPK phosphorylation sites in the Runx2 transcription factor. J Biol Chem 2009; 284(47):32533-43. doi: 10.1074/jbc.M109.040980 [Crossref] [ Google Scholar]
- Lee KS, Hong SH, Bae SC. Both the Smad and p38 MAPK pathways play a crucial role in Runx2 expression following induction by transforming growth factor-beta and bone morphogenetic protein. Oncogene 2002; 21(47):7156-63. doi: 10.1038/sj.onc.1205937 [Crossref] [ Google Scholar]
- Damoulis PD, Drakos DE, Gagari E, Kaplan DL. Osteogenic differentiation of human mesenchymal bone marrow cells in silk scaffolds is regulated by nitric oxide. Ann N Y Acad Sci 2007; 1117:367-76. doi: 10.1196/annals.1402.038 [Crossref] [ Google Scholar]
- Wahl DA, Czernuszka JT. Collagen-hydroxyapatite composites for hard tissue repair. Eur Cell Mater 2006; 11:43-56. doi: 10.22203/ecm.v011a06 [Crossref] [ Google Scholar]
- Nudelman F, Pieterse K, George A, Bomans PH, Friedrich H, Brylka LJ. The role of collagen in bone apatite formation in the presence of hydroxyapatite nucleation inhibitors. Nat Mater 2010; 9(12):1004-9. doi: 10.1038/nmat2875 [Crossref] [ Google Scholar]