Avicenna Journal of Medical Biochemistry. 10(2):114-119.
doi: 10.34172/ajmb.2022.2375
Original Article
Investigating Preventive Effect of Vitamin D and N-acetylcysteine Against Kidney Injury in Rats Versus the Promotive Effect of Paraquat
Hamed Felehgari 1, Nejat Khiripour 2, Fereshteh Mehri 3  , Sara Soleimani Asl 4, Davoud Ahmadimoghaddam 1, Akram Ranjbar 3, *
Author information:
1Department of Toxicology and Pharmacology, School of Pharmacy, Hamadan University of Medical Sciences, Hamadan, Iran
2Department of Clinical Biochemistry, Kashan University Medical Sciences, Kashan, Iran
3Nutrition Health Research Center, Center of Excellence for Occupational Health, Hamadan University of Medical Sciences, Hamadan, Iran
4Anatomy Department, School of Medicine, Hamadan University of Medical Sciences, Hamadan, Iran
Abstract
Background: Paraquat (PQ) is one of the most important herbicides used in agriculture.
Objectives: This study was conducted to compare the preventive effect of vitamin D (Vit D) and N-acetylcysteine (NAC) against kidney injury in rats versus the promotive effect of PQ.
Methods: In this study, rats were divided into six groups. The control group (group 1) received normal saline, Vit D group (group 2) received intraperitoneal (IP) injections of+Vit D (2 μg/kg), NAC group (group 3) received NAC (6.25 mg/kg, IP), PQ group (group 4) received PQ (5 mg/kg/d, IP), PQ+Vit D group (group 5) received PQ+Vit D (5 mg/kg/d+2 μg/kg/d, IP) and PQ+NAC group (group 6) received PQ+NAC (5 mg/kg/d+6.25 mg/kg/d, IP). The animals were treated for 7 consecutive days as a sub-chronic exposure. After the collection of urea and serum creatinine, biomarkers of oxidative stress and kidney histopathology were investigated.
Results: PQ increased lipid peroxidation (LPO), urea, and serum creatinine, but it significantly decreased total antioxidant capacity (TAC) and thiol groups. In the groups treated with Vit D and NAC, it was observed that LPO, urea, and creatinine significantly decrease compared with the PQ group, and TAC, thiol groups, and Vit D levels increased in kidney tissue.
Conclusion: The obtained findings revealed that both Vit D and NAC used as preventive compound were able to reduce oxidative stress and tissue damage caused by PQ toxicity in the kidney.
Keywords: Vitamin D, Paraquat, N-acetylcysteine, Kidney,
Copyright and License Information
© 2022 The Author(s); Published by Hamadan University of Medical Sciences.
This is an open-access article distributed under the terms of the Creative Commons Attribution License (
http://creativecommons.org/licenses/by/4.0), which permits unrestricted use, distribution, and reproduction in any medium provided the original work is properly cited.
Please cite this article as follows: Felehgari H, Khiripour N, Fereshteh M, Soleimani Asl S, Ahmadimoghaddam D, Ranjbar A. Investigating preventive effect of vitamin d and n-acetylcysteine against kidney injury in rats versus the promotive effect of paraquat. Avicenna J Med Biochem. 2022; 10(2):114-119. doi:10.34172/ajmb.2022.2375
Background
Paraquat (PQ) is an organic toxic compound that is extensively used in agriculture to control pesticides. PQ is known as a fast-acting non-selective agent, causing multiple-organ failure including kidney, lungs, liver, and brain (1,2) in humans. PQ has chemical properties such as low volatility and potential and is highly soluble in water; therefore, intentional or accidental consumption of PQ can result in serious threats to human health. Due to the lack of an effective treatment method for reducing PQ toxicity, this toxic causes high mortality of about 60%–70% yearly (1). Recent studies have demonstrated PQ-induced toxicity through the formation of toxic oxygen species followed by oxidative stress (3). The toxic effects of reactive oxygen species (ROS) are manifested through the oxidation of lipids, proteins, and DNA contents(4). Kidney tissue is the chief organ for toxicity of different compounds such as PQ, which is the main factor for the mortality caused by this toxin. Consequently, it is essential to carry out research on anti-PQ toxicity such as antioxidant compounds (5). N-acetylcysteine (NAC) is reported as an antioxidant compound with thiol groups that can scavenge free radicals. Besides NAC is a source of cysteine, often restraining the precursor of de novo glutathione (GSH) synthesis in the body. Although NAC is identified as the main line of treatment for the toxicity of acetaminophen, it has other medical uses with scientific support. Different studies also reported that NAC is used as the first-line treatment for the toxicity of PQ (5). Using NAC supplementation can increase GSH, thus suppressing the activity of NF-κB and decreasing the oxidative stress in the toxicity of PQ (6). Vitamin D (Vit D, ergocalciferol-D2, cholecalciferol-D3) is known as a fat-soluble vitamin. Investigations have indicated that, in addition to keeping normal levels of calcium in the body which is necessary for growth and development, Vit D has antioxidant effects. Vit D deficiency in the body can result in various diseases, including blood disease, diabetes, and dangerous kidney disease by changing the body’s protective system (7). According to studies, treatment via Vit D for an animal can decrease lipid peroxidation (LPO) of the membrane and increase superoxide dismutase (SOD) activity. Furthermore, Vit D can decrease ROS production by enhancing GSH concentration and increasing the expression of glutamate cysteine ligase genes and GSH reductase (8). Due to the high mortality by PQ pesticides and the absence of a suitable antidote for this toxin compound, it is essential to conduct comprehensive studies to determine the effectiveness of treatment with PQ poisoning. This study aimed to assess and compare the protective effects of Vit D and NAC against kidney damage induced by exposure to PQ toxic. Therefore, we assumed that Vit D and NAC yield protective effects by reducing the oxidative stress in kidney tissue. To test this theory, kidney histopathology, serum urea, creatinine concentration, and oxidative stress biomarkers were measured.
Materials and Methods
Chemical and Reagents
Nitric acid, perchloric acid, and acetic acid (glacial) pure were purchased from Merck (Germany). Ferric chloride hexahydrate, n-butanol, thiobarbituric acid (TBA), and SDS pure were obtained from Sigma-Aldrich (United States). All other compounds were of analytical grade.
Animal Treatment
In the present study, 36 adult male Wistar rats (180–250 g) were purchased from the Animal Care Center of Hamadan University. All ethical considerations were carefully taken. Animals were conserved under standard conditions of humidity (45–55%), temperature (23 ± 1°C), and 12 hours of dark/light cycle. The various groups of animals were fed standard food and ad libitum tap water during the study. After adaptation to the laboratory conditions, the rats were accidentally distributed into 6 groups (n = 8).
Study Design
In this study, rat were included in 6 groups: control group (group 1) received normal saline, Vit D group (group 2) received + Vit D (2 μg/kg, IP), NAC group (group 3) received NAC (6.25 mg/kg, IP), PQ group (group 4) received PQ (5 mg/kg/d, IP), PQ + Vit D group (group 5) received PQ + Vit D (5 mg/kg/d + 2 μg/kg/d, IP), and PQ + NAC group (group 6) received PQ + NAC (5 mg/kg/d + 6.25 mg/kg/d, IP) (9). The animals were treated intraperitoneally for 7 consecutive days as a sub-chronic exposure. At the end of the studies, the body weight of rats was determined. All rats were fainted by the administration of ketamine/xylazine (60 mg/kg and 6 mg/kg, IP, respectively) (9). After collecting blood samples from the intracardiac, samples were centrifuged at 250 × g for 15 minutes, and serum samples were kept at -18°C for biochemical analysis. In the following, kidney tissue was detached and washed with cold phosphate-buffered saline and then weighed. For pathological evaluation, a part of kidney tissue was retained in formalin solution, and for molecular analysis and stress oxidative, the other part of kidney tissue was saved in liquid nitrogen and was frozen at -80°C until the study time.
Sample Collection
The kidney tissues from the control and treated rat groups were washed with saline solution and were subsequently homogenized in 1:5 volumes of phosphate-buffered saline (pH = 7.4). The homogenate was suspended in ice-cold lysis buffer and incubated on ice for 20 minutes. The tissue homogenates were centrifuged at 14 000 × g for 10 minutes at 4°C, and the supernatant sample was frozen at -80°C for analysis.
Measurement of Oxidative Stress Biomarkers
Assessment of LPO of Kidney Tissue
For determining the content of kidney malondialdehyde as the main indicator for LPO, TBA was used for composition and reaction with LPO. The kidney tissue samples were combined with trichloroacetic acid 20% and were quickly spread in H2SO4 (0.05 M) solution. Then, TBA was subjected to heat for 30 minutes in boiling water at a high temperature. The TBA reactive substance adducts were obtained through n-butanol, and the maximum absorbance was determined as a pink complex at 532 nm (10).
Measuring Total Antioxidant Capacity of Kidney Tissue
Total antioxidant capacity (TAC) was analyzed using the ferric-reducing ability of plasma. This method was based on the capacity to reduce trivalent iron to divalent iron in the existence of 2, 4, 6-Tripyridyl-S-triazine. The reaction of divalent iron produced a blue complex with a maximum absorbance of 593 nm(11).
Measuring Content of Total Thiol Molecules (TTM) of Kidney Tissue
TTM as the main indicator for GSH in kidney tissue homogenate samples was determined according to the Hu method. Dithinitrobazoic acid reacted with TTM and led to the production of a yellow complex that has an optimal absorbance at 412 nm (11).
Measuring Kidney Vit D, Serum Urea, and Creatinine Levels
Kidney Vit D was measured using MyBioSource kit (Belgium) and enzymatic methods. Levels of serum urea and creatinine were measured using a Pars Azmoon kit (Iran) and enzymatic methods.
Histological Investigation
For histological calculations, a small section of kidney tissues was fixed in 10% formalin composition, dried up in ethanol solution (50–100%), cleared in xylene solution, and then surrounded in paraffin. Kidney sections (5 μm) were stained by hematoxylin and eosin stain based on standard pathology laboratory procedures and assessed under light microscopy.
Statistical Analysis
The findings were presented as mean ± standard deviation and were statistically examined using a one-way analysis of variance (ANOVA) followed by post hoc via the Bonferroni test. Prism 5.0 software was applied for the data analyses, and a P value of less than 0.05 was considered to be statistically significant.
Results
Effects of Vit D and NAC on the LPO Biomarker of Kidney Tissue
As shown in Figure 1, a significant increase in LPO was observed in the PQ group against the control group (P < 0.01), whereas using Vit D and NAC resulted in decreased levels of LPO (P < 0.01) compared to the PQ group (P < 0.05).
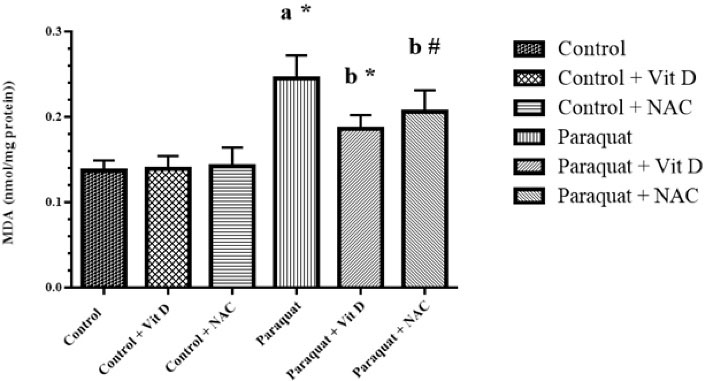
Figure 1.
Kidney LPO Level. Note. LPO: Lipid peroxidation; MDA: Malondialdehyde; Vit D: Vitamin D; NAC: N-acetylcysteine; SD: Standard deviation. Values are the Mean ± SD for each group. aSignificantly different from control group. bSignificantly different from paraquat group. #P < 0.05 and *P < 0.01
.
Kidney LPO Level. Note. LPO: Lipid peroxidation; MDA: Malondialdehyde; Vit D: Vitamin D; NAC: N-acetylcysteine; SD: Standard deviation. Values are the Mean ± SD for each group. aSignificantly different from control group. bSignificantly different from paraquat group. #P < 0.05 and *P < 0.01
Effects of Vit D and NAC on the TAC and GSH Biomarkers of Kidney Tissue
The level of TAC and GSH significantly reduced in the PQ group (P < 0.01) compared to the control group (P < 0.05), and treatment with Vit D and NAC significantly reversed TAC in the treated groups (P < 0.05). Furthermore, treatment with Vit D and NAC had no significant effect on GSH in the treatment groups (Figures 2 and 3).
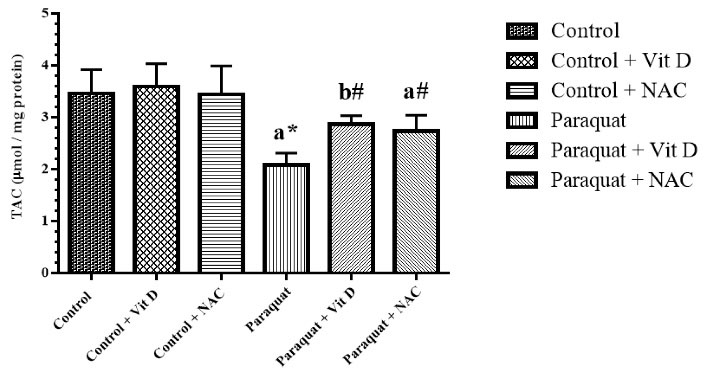
Figure 2.
Kidney TAC Level. Note. TAC: Total antioxidant capacity; Vit D: Vitamin D; NAC: N-acetylcysteine; SD: Standard deviation. Values are the mean ± SD for each group. aSignificantly different from control. bSignificantly different from paraquat group. #P < 0.05 and *P < 0.01
.
Kidney TAC Level. Note. TAC: Total antioxidant capacity; Vit D: Vitamin D; NAC: N-acetylcysteine; SD: Standard deviation. Values are the mean ± SD for each group. aSignificantly different from control. bSignificantly different from paraquat group. #P < 0.05 and *P < 0.01
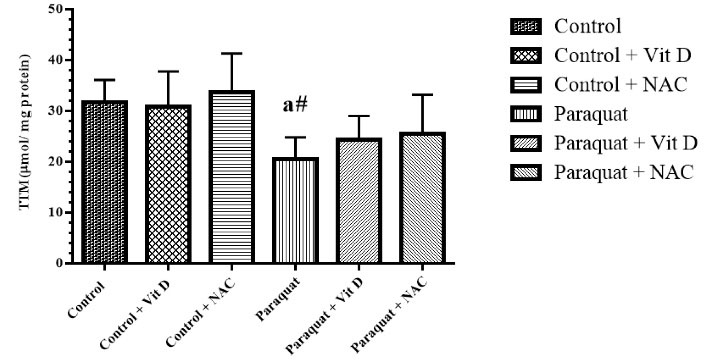
Figure 3.
Kidney TTM Level. Note. TTM: Total thiol molecules; Vit D: Vitamin D; NAC: N-acetylcysteine; SD: Standard deviation. Values are the mean ± SD for each group. aSignificantly different from control. bSignificantly different from paraquat group. #P < 0.05 and *P < 0.01
.
Kidney TTM Level. Note. TTM: Total thiol molecules; Vit D: Vitamin D; NAC: N-acetylcysteine; SD: Standard deviation. Values are the mean ± SD for each group. aSignificantly different from control. bSignificantly different from paraquat group. #P < 0.05 and *P < 0.01
Effects of Vit D and NAC on Kidney Function Parameters
According to Figures 4 and 5, the content of serum urea and creatinine in the PQ group significantly improved compared to that of the control group (P < 0.01). Administration of Vit D and NAC significantly reduced urea and creatinine levels of serum in the control group compared to that in the PQ group (P < 0.01 and P < 0.05, respectively).
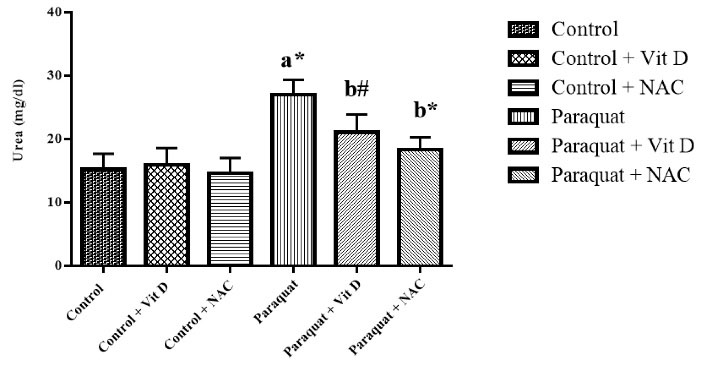
Figure 4.
Kidney Urea Level. Note. Vit D: Vitamin D; NAC: N-acetylcysteine; SD: Standard deviation. Values are the mean ± SD for each group. aSignificantly different from control. bSignificantly different from paraquat group. #P < 0.05 and *P < 0.01
.
Kidney Urea Level. Note. Vit D: Vitamin D; NAC: N-acetylcysteine; SD: Standard deviation. Values are the mean ± SD for each group. aSignificantly different from control. bSignificantly different from paraquat group. #P < 0.05 and *P < 0.01
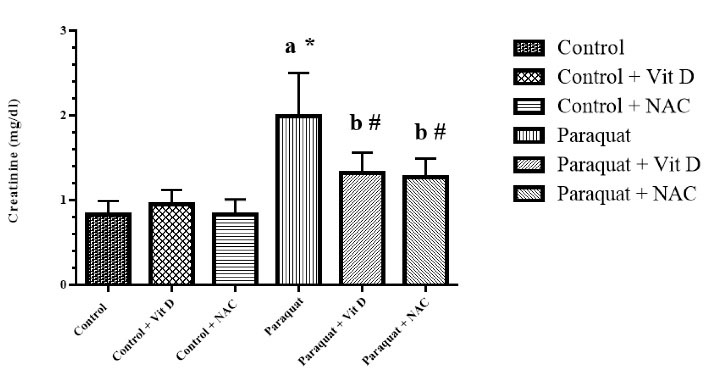
Figure 5.
Serum Creatinine Level. Note. Vit D: Vitamin D; NAC: N-acetylcysteine; SD: Standard deviation. Values are the mean ± SD for each group. aSignificantly different from control. bSignificantly different from paraquat group. #P< 0.05 and *P < 0.01
.
Serum Creatinine Level. Note. Vit D: Vitamin D; NAC: N-acetylcysteine; SD: Standard deviation. Values are the mean ± SD for each group. aSignificantly different from control. bSignificantly different from paraquat group. #P< 0.05 and *P < 0.01
Vit D Concentration and Weight of Kidney
As Figure 6 indicates, the levels of kidney Vit D in the PQ group significantly increased compared to those of the control group (P < 0.05). Moreover, the administration of Vit D and NAC did not reduce kidney Vit D levels significantly compared to the PQ group. In addition, the kidney weight in the PQ group significantly increased (P < 0.01) compared to the control groups. Finally, treatment with NAC decreased kidney weight (P > 0.05) in the control group compared to that in the PQ group (Figure 7).
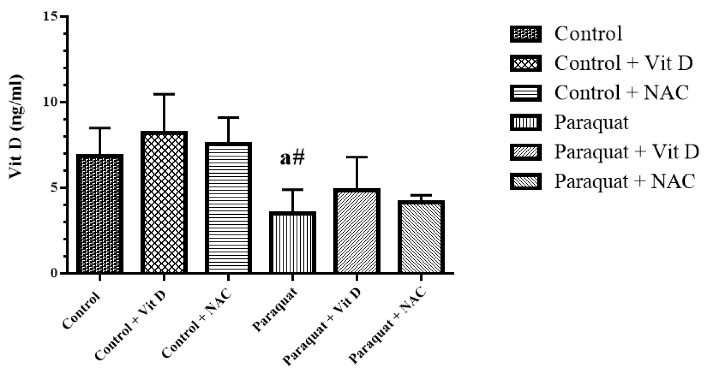
Figure 6.
Kidney Vit D Level. Note. Vit D: Vitamin D; NAC: N-acetylcysteine; SD: Standard deviation. Values are the mean ± SD for each group. aSignificantly different from control. bSignificantly different from paraquat group. #P < 0.05 and *P < 0.01
.
Kidney Vit D Level. Note. Vit D: Vitamin D; NAC: N-acetylcysteine; SD: Standard deviation. Values are the mean ± SD for each group. aSignificantly different from control. bSignificantly different from paraquat group. #P < 0.05 and *P < 0.01
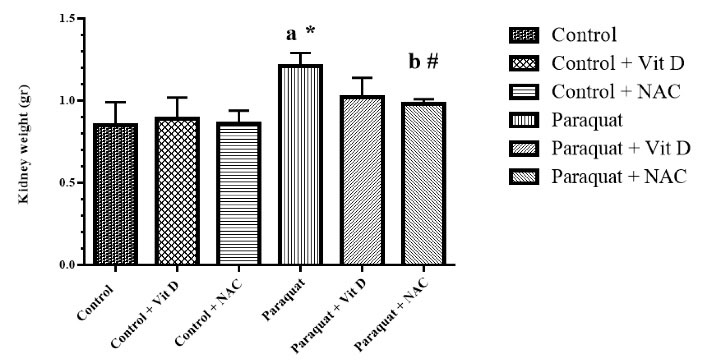
Figure 7.
Kidney MDA Level. Note. MDA: Malondialdehyde; Vit D: Vitamin D; NAC: N-acetylcysteine; SD: Standard deviation. Values are the mean ± SD for each group. aSignificantly different from control. bSignificantly different from paraquat group. #P < 0.05 and *P < 0.01
.
Kidney MDA Level. Note. MDA: Malondialdehyde; Vit D: Vitamin D; NAC: N-acetylcysteine; SD: Standard deviation. Values are the mean ± SD for each group. aSignificantly different from control. bSignificantly different from paraquat group. #P < 0.05 and *P < 0.01
Effects of Vit D and NAC on PQ- induced Histological Changes
To evaluate the effect of Vit D and NAC on PQ toxicity of kidney structure, hematoxylin & eosin staining was used. Accordingly, the renal corpuscle, proximal convoluted tubule, distal convoluted tubule, and urinary tract were evaluated. Each kidney has a network of capillaries called glomeruli surrounded by a two-layer capsule called the Bowman capsule. Between the two layers of the Bowman capsule, there is a urinary tract. The findings of the current study indicated significant changes in the structure of the kidneys following the administration of PQ compared to the control group. Further, kidney sections of PQ rats treated with Vit D and NAC exhibited pathological alterations compared to those of the control rats (Figure 8).
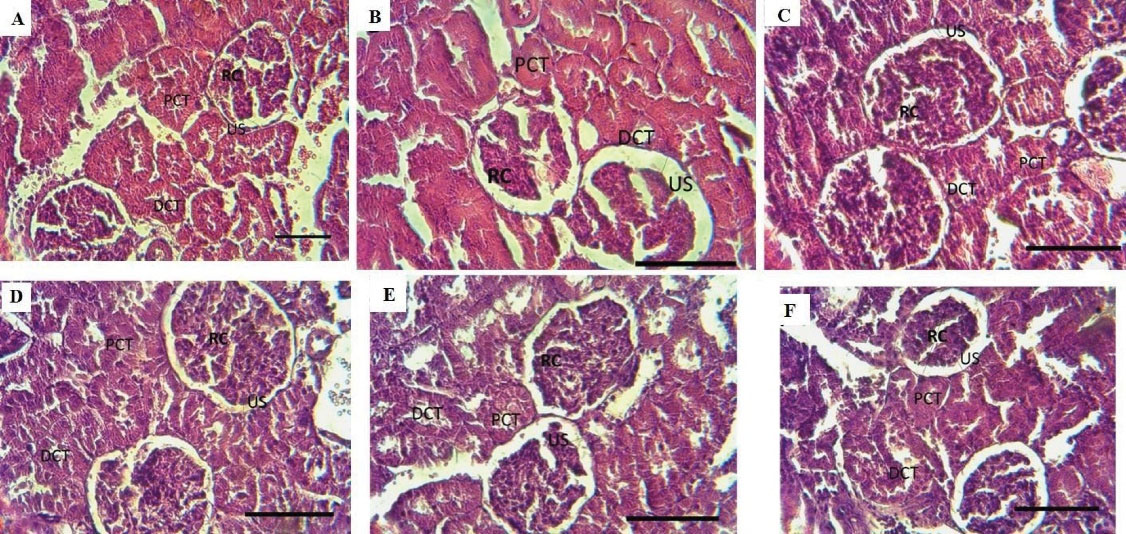
Figure 8.
Histological Sections of Kidney From the Control (A) and PQ (D). Control (B, C) and PQ (E, F) received Vit D and NAC daily for 7 days (Magnification: 40 × ). Note. PQ: Paraquat; Vit D: Vitamin D; NAC: N-acetylcysteine
.
Histological Sections of Kidney From the Control (A) and PQ (D). Control (B, C) and PQ (E, F) received Vit D and NAC daily for 7 days (Magnification: 40 × ). Note. PQ: Paraquat; Vit D: Vitamin D; NAC: N-acetylcysteine
Discussion
It has been presented that herbicides can produce several histopathological and stress oxidative changes. PQ is a herbicide that is extensively applied in agriculture and has various toxicity mechanisms in a variety of organs such as the kidney. PQ can strongly stimulate the formation of ROS. The ROS are highly toxic and may cause serious damage to various organs and tissues. Given that oxidative stress is involved in PQ-induced cytotoxicity (12,13), the current study intended to estimate whether treatment with Vit D and NAC would have a protective effect against PQ-induced kidney injury in rats. Based on the results, the administration of Vit D and NAC significantly reduced malondialdehyde and increased levels of TAC and GSH compared to the PQ group. Furthermore, the administration of Vit D did not reduce kidney Vit D levels significantly compared to the PQ group. This indicated that Vit D and NAC may have protective effects on PQ toxicity via their anti-oxidation properties. Prolonged exposure to PQ can induce toxicity related to direct tubular, oxidative stress, inflammation, and apoptosis process in animals (14,15). In our study, PQ led to failure in renal function, which was indicated by loss of weight and function. For the evaluation of this disorder, the content of urea and creatinine serum, two main biomarkers for discovering damage to kidney tissue in poisoning with PQ, were detected. Normally, urea is a byproduct of the digestion of protein in the body, and creatinine is a waste product of creatine phosphate excreted by the kidneys. However, in the case of PQ poisoning, their concentration rises due to renal dysfunction(15). In this study, it was found that the treatment with PQ led to an increase in urea level and convoyed by accretion of creatinine content, indicating that PQ contact damaged kidney function. Furthermore, although the histological assessment showed no significant variations in the structure of the kidneys, kidney weight in the PQ group significantly increased compared to that in control groups. The results of the current study are in line with the findings obtained by Sharp et al(16) and Wei et al (17). Obviously, treatment with Vit D and NAC revealed a protective effect against nephrotoxic PQ as documented by low serum levels of urea and creatinine. Despite the precise mechanisms of PQ-induced kidney damage that were not identified, it was documented that the generation of singlet oxygen and other toxic free radicals results in a rise in LPO of cell membranes (18). Therefore, the origination of PQ-induced kidney injury is largely linked with an increase in oxidative stress. LPO by active oxygen production plays the main role in biochemical events induced by PQ toxicity as designated in several experimental studies(19,20). In this study, the contents of LPO, as degradation crops of polyunsaturated lipids created in response to oxidative biomarkers were identified. The obtained findings indicated an increase in LPO levels in rats treated with PQ, showing oxidative stress in kidney tissues. These observations were in agreement with previous information(21,22). In addition to oxidative stress generation, PQ as a pesticide can reduce protection systems. TAC and GSH are the supreme antioxidant compounds in contradiction of ROS in the body (23) and can defeat oxidative stress. Antioxidant enzymes change active radical species to less harmful or safe products (24). In this study, a remarkable reduction was observed in kidney TAC and GSH in rats that received PQ. These outcomes support the result of Rahmani et al (25), Schapochnik et al (26), and Hong et al(27) who found a significant reduction in GSH and TAC of animals’ expected PQ. The high production of toxic free radicals has preventing and inhibitory influences on anti-oxidative enzymes in the body(28). For example, the aggregation of superoxide anions can prevent GSH activity (29). Clearly, co-treatment with Vit D and NAC significantly augmented serum levels in the kidney of GSH and TAC, indicating that Vit D and NAC might reestablish the activity of these enzymes. It seems that Vit D and NAC have the potential of reducing intoxication. Ortiz et al found the protective effect of NAC on the toxicity of PQ in vital organs, and they confirmed the effect of NAC against PQ toxicity (30). NAC protects the antioxidant defenses against oxidative injury as a product of ROS scavenge in the dopaminergic system of neuronal cells (31). The other possible mechanisms related to the protective effect of NAC result from the richness of sulfhydryl group and NAC’s role as a precursor of cysteine which is used in GSH biosynthesis (31). As expected, according to this mechanism, we observed the GSH reduction induced by PQ and the improvement of GSH induced by NAC. In line with the current results, Rahmani et al (25) and Alvarez et al (32) asserted that a high level of Vit D increases the serum concentration of GSH (32). The exact mechanism of Vit D regarding the reduction in LPO level and increase in GSH and TAC activity induced by PQ is not yet known, but various studies have suggested that by affecting the MEK-SIRT1 pathway and reducing H2O2,Vit D eventually decreases oxidative stress, and by impacting Keap1 Nrf2 route, it exerts antioxidant effects in various tissues (33,34).
Conclusion
The results of this study suggested that PQ induced kidney toxicity, but the antioxidative properties of Vit D and NAC improved toxic oxidative stress in the kidney tissue of PQ toxicity in animals. These data may contribute to the management and treatment strategies of PQ poisoning patients. However, more evaluations are required to detect the molecular mechanism of Vit D and NAC effects.
Acknowledgments
The authors appreciate the Deputy of Research and Technology, Hamadan University of Medical Sciences for their support in this research.
Author Contributions
Conceptualization: Hamed Felehgari.
Data curation: Fereshteh Mehri.
Formal Analysis: Fereshteh Mehri.
Funding acquisition: Akram Ranjbar.
Investigation: Akram Ranjbar.
Methodology: Akram Ranjbar.
Project administration: Akram Ranjbar.
Resources:Akram Ranjbar, Fereshteh Mehri.
Software: Akram Ranjbar, Fereshteh Mehri.
Visualization: Nejat Khiripour.
Writing – original draft: Davoud Ahmadimoghaddam.
Writing – review & editing: Davoud Ahmadimoghaddam, Sara Soleimani Asl.
Conflict of Interests
All authors state that there is no conflict of interests concerning the publication of this study.
Ethical Issues
This study was approved by the Ethics Committee of Hamadan University of Medical Sciences (Code: IR.UMSHA.REC.1395.485).
Funding/Support
This study was financially confirmed by the Hamadan University of Medical Sciences (No: 9511126745).
References
- Nunes ME, Müller TE, Braga MM, Fontana BD, Quadros VA, Marins A. Chronic treatment with paraquat induces brain injury, changes in antioxidant defenses system, and modulates behavioral functions in zebrafish. Mol Neurobiol 2017; 54(6):3925-34. doi: 10.1007/s12035-016-9919-x [Crossref] [ Google Scholar]
- Amirshahrokhi K, Bohlooli S. Effect of methylsulfonylmethane on paraquat-induced acute lung and liver injury in mice. Inflammation 2013; 36(5):1111-21. doi: 10.1007/s10753-013-9645-8 [Crossref] [ Google Scholar]
- McCormack AL, Atienza JG, Johnston LC, Andersen JK, Vu S, Di Monte DA. Role of oxidative stress in paraquat-induced dopaminergic cell degeneration. J Neurochem 2005; 93(4):1030-7. doi: 10.1111/j.1471-4159.2005.03088.x [Crossref] [ Google Scholar]
- Niu J, Wang K, Kolattukudy PE. Cerium oxide nanoparticles inhibit oxidative stress and nuclear factor-κB activation in H9c2 cardiomyocytes exposed to cigarette smoke extract. J Pharmacol Exp Ther 2011; 338(1):53-61. doi: 10.1124/jpet.111.179978 [Crossref] [ Google Scholar]
- Moridi H, Hosseini SA, Shateri H, Kheiripour N, Kaki A, Hatami M. Protective effect of cerium oxide nanoparticle on sperm quality and oxidative damage in malathion-induced testicular toxicity in rats: An experimental study. Int J Reprod Biomed 2018; 16(4):261-6. [ Google Scholar]
- Atkuri KR, Mantovani JJ, Herzenberg LA, Herzenberg LA. N-Acetylcysteine--a safe antidote for cysteine/glutathione deficiency. Curr Opin Pharmacol 2007; 7(4):355-9. doi: 10.1016/j.coph.2007.04.005 [Crossref] [ Google Scholar]
- Holick MF. Vitamin D for health and in chronic kidney disease. Semin Dial 2005; 18(4):266-75. doi: 10.1111/j.1525-139X.2005.18402.x [Crossref] [ Google Scholar]
- Jain SK, Micinski D, Huning L, Kahlon G, Bass PF, Levine SN. Vitamin D and L-cysteine levels correlate positively with GSH and negatively with insulin resistance levels in the blood of type 2 diabetic patients. Eur J Clin Nutr 2014; 68(10):1148-53. doi: 10.1038/ejcn.2014.114 [Crossref] [ Google Scholar]
- Beydilli H, Yilmaz N, Cetin ES, Topal Y, Celik OI, Sahin C. Evaluation of the protective effect of silibinin against diazinon induced hepatotoxicity and free-radical damage in rat liver. Iran Red Crescent Med J 2015; 17(4):e25310. doi: 10.5812/ircmj.17(4)2015.25310 [Crossref] [ Google Scholar]
- Ranjbar A, Kheiripour N, Ghasemi H, Seif Rabiei MA, Dadras F, Khoshjou F. Antioxidative effects of tempol on mitochondrial dysfunction in diabetic nephropathy. Iran J Kidney Dis 2018; 12(2):84-90. [ Google Scholar]
- Ghadermazi R, Khoshjou F, Hossini Zijoud SM, Behrooj H, Kheiripour N, Ganji M. Hepatoprotective effect of tempol on oxidative toxic stress in STZ-induced diabetic rats. Toxin Rev 2018; 37(1):82-6. doi: 10.1080/15569543.2017.1313277 [Crossref] [ Google Scholar]
- Benzie IF, Strain JJ. The ferric reducing ability of plasma (FRAP) as a measure of “antioxidant power”: the FRAP assay. Anal Biochem 1996; 239(1):70-6. doi: 10.1006/abio.1996.0292 [Crossref] [ Google Scholar]
- Hsu HH, Chang CT, Lin JL. Intravenous paraquat poisoning-induced multiple organ failure and fatality--a report of two cases. J Toxicol Clin Toxicol 2003; 41(1):87-90. doi: 10.1081/clt-120018278 [Crossref] [ Google Scholar]
- Kimbrough RD. Toxic effects of the herbicide paraquat. Chest 1974;65:Suppl:65S-7S. 10.1378/chest.65.4_supplement.65s.
- Yoon SP, Han MS, Kim JW, Chang IY, Kim HL, Chung JH. Protective effects of chitosan oligosaccharide on paraquat-induced nephrotoxicity in rats. Food Chem Toxicol 2011; 49(8):1828-33. doi: 10.1016/j.fct.2011.04.036 [Crossref] [ Google Scholar]
- Sharp CW, Ottolenghi A, Posner HS. Correlation of paraquat toxicity with tissue concentrations and weight loss of the rat. Toxicol Appl Pharmacol 1972; 22(2):241-51. doi: 10.1016/0041-008x(72)90174-3 [Crossref] [ Google Scholar]
- Wei T, Tian W, Liu F, Xie G. Protective effects of exogenous β-hydroxybutyrate on paraquat toxicity in rat kidney. Biochem Biophys Res Commun 2014; 447(4):666-71. doi: 10.1016/j.bbrc.2014.04.074 [Crossref] [ Google Scholar]
- Ranjbar A. Evidence of oxidative damage in paraquat toxicity. Zahedan J Res Med Sci 2014; 16(12):1-8. [ Google Scholar]
- Awadalla EA. Efficacy of vitamin C against liver and kidney damage induced by paraquat toxicity. Exp Toxicol Pathol 2012; 64(5):431-4. doi: 10.1016/j.etp.2010.10.009 [Crossref] [ Google Scholar]
- Mehri F, Goodarzi MT, Esfahani M. The possible protective effect of resveratrol on diazinon-induced oxidative stress and hepatic injury. Avicenna J Med Biochem 2020; 8(1):44-8. doi: 10.34172/ajmb.2020.06 [Crossref] [ Google Scholar]
- Nouri A, Heibati F, Heidarian E. Gallic acid exerts anti-inflammatory, anti-oxidative stress, and nephroprotective effects against paraquat-induced renal injury in male rats. Naunyn Schmiedebergs Arch Pharmacol 2021; 394(1):1-9. doi: 10.1007/s00210-020-01931-0 [Crossref] [ Google Scholar]
- Weng CH, Chen HH, Hu CC, Huang WH, Hsu CW, Fu JF. Predictors of acute kidney injury after paraquat intoxication. Oncotarget 2017; 8(31):51345-54. doi: 10.18632/oncotarget.17975 [Crossref] [ Google Scholar]
- Mavelli I, Rigo A, Federico R, Ciriolo MR, Rotilio G. Superoxide dismutase, glutathione peroxidase and catalase in developing rat brain. Biochem J 1982; 204(2):535-40. doi: 10.1042/bj2040535 [Crossref] [ Google Scholar]
- Jafari M, Salehi M, Ahmadi S, Asgari A, Abasnezhad M, Hajigholamali M. The role of oxidative stress in diazinon-induced tissues toxicity in Wistar and Norway rats. Toxicol Mech Methods 2012; 22(8):638-47. doi: 10.3109/15376516.2012.716090 [Crossref] [ Google Scholar]
- Rahmani G, Soleimani S, Nili Ahmad Abadi A, Larki A, Ranjbar A. The comparison of N-acetylcysteine and vitamin D on oxidative liver toxicity in sub-acute paraquat poisoning. J Babol Univ Med Sci 2018; 20(7):14-20. doi: 10.18869/acadpub.jbums.20.7.14 [Crossref] [ Google Scholar]
- Schapochnik A, da Silva MR, Leal MP, Esteves J, Hebeda CB, Sandri S. Vitamin D treatment abrogates the inflammatory response in paraquat-induced lung fibrosis. Toxicol Appl Pharmacol 2018; 355:60-7. doi: 10.1016/j.taap.2018.06.020 [Crossref] [ Google Scholar]
- Hong SY, Hwang KY, Lee EY, Eun SW, Cho SR, Han CS. Effect of vitamin C on plasma total antioxidant status in patients with paraquat intoxication. Toxicol Lett 2002; 126(1):51-9. doi: 10.1016/s0378-4274(01)00431-3 [Crossref] [ Google Scholar]
- El-Shenawy NS, El-Salmy F, Al-Eisa RA, El-Ahmary B. Amelioratory effect of vitamin E on organophosphorus insecticide diazinon-induced oxidative stress in mice liver. Pestic Biochem Physiol 2010; 96(2):101-7. doi: 10.1016/j.pestbp.2009.09.008 [Crossref] [ Google Scholar]
- Kayış T, Emre İ, Coşkun M. Effects of diazinon on antioxidant enzymes and adult emergence of the parasitoid Pimplaturionellae L (Hymenoptera: Ichneumonidae). Türk Entomol Derg 2012; 36(4):463-71. [ Google Scholar]
- Ortiz MS, Forti KM, Suárez Martinez EB, Muñoz LG, Husain K, Muñiz WH. Effects of antioxidant N-acetylcysteine against paraquat-induced oxidative stress in vital tissues of mice. Int J Sci Basic Appl Res 2016; 26(1):26-46. [ Google Scholar]
- Schulz JB, Lindenau J, Seyfried J, Dichgans J. Glutathione, oxidative stress and neurodegeneration. Eur J Biochem 2000; 267(16):4904-11. doi: 10.1046/j.1432-1327.2000.01595.x [Crossref] [ Google Scholar]
- Alvarez JA, Chowdhury R, Jones DP, Martin GS, Brigham KL, Binongo JN. Vitamin D status is independently associated with plasma glutathione and cysteine thiol/disulphide redox status in adults. Clin Endocrinol (Oxf) 2014; 81(3):458-66. doi: 10.1111/cen.12449 [Crossref] [ Google Scholar]
- Polidoro L, Properzi G, Marampon F, Gravina GL, Festuccia C, Di Cesare E. Vitamin D protects human endothelial cells from H₂O₂ oxidant injury through the Mek/Erk-Sirt1 axis activation. J Cardiovasc Transl Res 2013; 6(2):221-31. doi: 10.1007/s12265-012-9436-x [Crossref] [ Google Scholar]
- Nakai K, Fujii H, Kono K, Goto S, Kitazawa R, Kitazawa S. Vitamin D activates the Nrf2-Keap1 antioxidant pathway and ameliorates nephropathy in diabetic rats. Am J Hypertens 2014; 27(4):586-95. doi: 10.1093/ajh/hpt160 [Crossref] [ Google Scholar]