Avicenna Journal of Medical Biochemistry. 10(2):95-100.
doi: 10.34172/ajmb.2022.2389
Original Article
Keap1 Gene Variants (rs11085735) and Lipid Profile in Obese Individuals From Kurdistan, Iraq
Avan Arif Ahmad 1  , Zohreh Rahimi 1, 2, * , Asad Vaisi-Raygani 1
Author information:
1Department of Clinical Biochemistry, Kermanshah University of Medical Sciences, Kermanshah, Iran
2Medical Biology Research Center, Kermanshah University of Medical Sciences, Kermanshah, Iran
Abstract
Background: Obesity is defined as excessive fat accumulation in the adipose tissue and peripheral organs. The Kelch-like ECH-associated protein 1 (Keap1) is involved in cellular protection in obesity.
Objectives: The objectives of this study were to detect the association of Keap1 rs11085735 variants with the risk of obesity in relation to anthropometric parameters and lipid profile in a population from the Kurdistan of Iraq.
Methods: A total of 265 volunteers (134 females and 131 males) were randomly selected. According to the body mass index (BMI), individuals were divided into subjects with normal BMI (131 healthy individuals) and obese subjects (134 obese volunteers). Anthropometry and lipid profile parameters were measured in these volunteers and Keap1 rs11085735 variants were identified by the polymerase chain reaction (PCR) followed by digestion with HinfI restriction enzyme.
Results: Triglycerides and low-density lipoprotein cholesterol (LDL-C) serum levels were significantly higher (P<0.001) in the obese group compared to the control group. The serum level of high-density lipoprotein cholesterol (HDL-C) was significantly lower (P=0.02) in the obese individuals than in the controls. Moreover, the waist, hip, and wrist circumferences and the waist to hip ratio in obese individuals were significantly higher than in controls (P<0.001). The frequency of Keap1 AA genotype was 1.5% in the obese group and 0% in the controls (P=0.36). The frequency of A allele was 4.9% and 3.1% in obese subjects and controls, respectively (P=0.28). Considering all individuals, carriers of AA genotype of Keap1 had significantly higher BMI and waist and hip circumferences compared to the carriers of AC and CC genotypes.
Conclusion: The present study found abnormal lipid profile among obese individuals compared to individuals with normal BMI. Our findings indicated that the presence of Keap1 polymorphism influenced the anthropometric parameters, and the carriers of AA genotype of Keap1 had significantly higher BMI and waist and hip circumferences compared to the carriers of AC and CC genotypes.
Keywords: Obesity, Keap1 variants, Anthropometry,
Copyright and License Information
© 2022 The Author(s); Published by Hamadan University of Medical Sciences.
This is an open-access article distributed under the terms of the Creative Commons Attribution License (
http://creativecommons.org/licenses/by/4.0), which permits unrestricted use, distribution, and reproduction in any medium provided the original work is properly cited.
Please cite this article as follows: Ahmad AA, Rahimi Z, Vaisi-Raygani A. Keap1 gene variants (rs11085735) and lipid profile in obese individuals from kurdistan, iraq. Avicenna J Med Biochem. 2022; 10(2):95-100. doi:10.34172/ajmb.2022.2389
Background
The prevalence of obesity as a global problem is increasing in the world (1,2). Worldwide, there are 1 billion overweight individuals and 300 million obese persons. It is estimated that in 2030, 2 billion individuals will be overweight and there be 1.12 billion obese subjects around the world (3). Obesity, an excess amount of body fat, is a major risk factor for mortality (4). The risk of mortality from cardiovascular diseases related to obesity was 13%, and a body mass index (BMI) equal or more than 25 kg/m2 could enhance the risk of all-cause mortality to around 30% (5). The prevalence of obesity as a chronic inflammatory disease is enhancing. Ectopic and the excess accumulation of fat may result in adverse health effects and decreased life span. BMI, defined as the weight (kg)/height squared (m2), is commonly used to identify underweight individuals with a BMI equal or lower than 18.5 kg/m2, normal weight subjects with a BMI of 18.5-24.9kg/m2, overweight individuals with a BMI of 25-30 kg/m2, and obese adults with a BMI equal or more than 30 kg/m2 (6).
Ectopic and excess fat accumulation leads to adverse health effects and decreased life span. Individuals with BMI exceeding 30 kg/m2 are considered obese. However, BMI does not evaluate the lean-to-fat mass ratio. A more precise evaluation of adiposity is performed by calculating the body fat distribution by measurement of the waist circumference or waist-to-hip ratio (7). The high mortality and morbidity rates related to obesity are largely attributed to cardiovascular complications (8). Obesity and obesity-associated metabolic and cardiovascular risk factors are designated as cardio-metabolic syndrome. These risk factors include hypertension, dyslipidemia, and type 2 diabetes mellitus (T2DM) (9).
Obesity can be affected by many factors including genetic background and lifestyle (10). The signaling pathway of nuclear factor erythroid 2-like 2 (Nrf2)/Kelch like ECH associated protein 1 (Keap1) protects cells, tissues, organs, and systems from oxidative stress. Therefore, Nrf2 is known as a multi-organ protector (11,12). This pathway is involved in antioxidant defense mechanisms in cardiovascular diseases including atherosclerosis and hypertension (13,14). In the pathway, where Nrf2 is the main regulator of oxidant/antioxidant balance, the cellular response is controlled to prevent injury to redox-sensitive cellular components (14). The Nrf2 transcription factor is tightly regulated by the cytoplasmic repressor Keap1. Keap1 plays a key role in the degradation of Nrf2 by the pathway of ubiquitin–proteasome (15). In oxidative stress, Nrf2 separates from Keap1, translocates to the nucleus, and activates many cytoprotective genes against the oxidative stress (16,17).
The polymorphism of Keap1 (A/C) rs11085735 is an intron variant which does not directly affect an amino acid sequence and protein structure. However, this polymorphism is located in the intron 2 of the Keap1 gene relatively close to the exon 3 of the gene (73-bp); therefore, it might have functional consequences by affecting the splicing of the Keap1 mRNA (18) and influence the structure of Kelch-1 domain and the interaction of Keap1 with Nrf2 (19). The frequency of the minor A allele of Keap1 is different in various populations. The frequency of A allele was found to be 7% in Europeans and 12.4% in Africans. Its overall frequency among Asians was reported to be 0.1%, ranging from 0% in East Asian to 2.6% in South Asian populations (20). Previously, we reported a frequency of 4% for A allele of Keap1 among healthy individuals with Kurdish ethnic background from Western Iran (21)
This study aimed to detect the frequency of Keap1 rs11085735 gene variants in obese individuals compared to healthy subjects with normal BMI and to find a possible association between this polymorphism and the risk of obesity in relation to anthropometric characteristics and lipid profile among a population from Sulaimani, Iraq.
Materials and Methods
Study Design
This case-control study enrolled a total of 265 individuals from Sulaimani, Kurdistan, Iraq. The sample consisted of 134 females and 131 males. The 265 volunteers were classified into two groups according to their BMI, including obese individuals (BMI ≥ 30 kg/m2) and age- and gender-matched healthy individuals with normal BMI (BMI of 18.5 to 24.9 kg/m2). They were referred to the public health laboratory in the teaching hospital Sulaimani from May to September 2021. The volunteers were apparently healthy people who were accompanying patients, apparently healthy obese volunteers, and apparently healthy staff of the laboratory. Pregnant women and patients who had blood transfusion or surgery in the last three months were excluded from the study. The studied individuals were not smokers or alcohol consumers. Additionally, they had a mixed diet including meat and vegetables and most of them did not have physical activity. Healthy individuals with 20 to 59 years of age and obesity were selected for the present study. The exclusion criteria were smoking, alcoholism, neuropsychiatric disorders, consumption of anorexigenic agents or anabolic steroids, hypothyroidism, polycystic ovarian syndrome, chronic diseases, and pregnancy or plans to become pregnant during the study period. Participants with a history of hypertension, diabetes, kidney disease, and/or cardiovascular diseases were excluded from the study. Anthropometric parameters including height, weight, and waist, hip, and wrist circumferences were measured. BMI was measured by dividing the weight (kg) by the height squared (m2) and accordingly, a BMI of ≥ 30 kg/m2, based on the World Health Organization classification, was used to define obesity.
Sampling
First, 6 mL of fasting venous blood sample was obtained in the morning from individuals with normal BMI and obese individuals. Then, the blood samples were collected in EDTA tubes (3 mL) for DNA extraction and serum gel separator tubes (3 mL), which were allowed to clot and settle at room temperature while participants were in sitting position during blood aspiration. The serum was separated immediately from blood samples by centrifugation at 4000 rpm for 10 minutes.
Analysis of Biochemical Parameters
The serum levels of total cholesterol, high-density lipoprotein cholesterol (HDL-C), low-density lipoprotein cholesterol (LDL-C), and triglycerides (TG) were measured by standard enzymatic methods using an automated Biochemistry Analyzer [KENZA 450 TX (BIOLABO Diagnostics), France].
Genotyping
DNA extraction from the peripheral blood leukocytes was done using the standard phenol–chloroform method. The DNA content of the samples was measured and the purity of DNA was assessed by a NanoDrop spectrophotometer. Using the polymerase chain reaction (PCR), DNA was amplified. The PCR products were digested with HinfI restriction enzyme, using the restriction fragment length polymorphism (RFLP) method, to identify the genotypes of the Keap1 A/C (rs11085735) gene. Briefly, DNA was amplified using the PCR method by the specific primers of P1: 5ˊ GGT CAC TGA CTA GAA CTC TCC AAG G 3ˊ (the forward primer) and P2: 5ˊ GCT GCA TCC ACC ACA ACA GTG T 3ˊ (the reverse primer). PCR reaction (20 μL) included 1 μL of DNA (200–600 ng), 1 μL of each primer (100 pmol),7 μL of ddH2O, and 10 μL of master mix 2X that contained MgCl2, dNTPs, PCR buffer, and Taq DNA polymerase. The optimized ready-to-use Master Mix was used for the amplification of DNA. The PCR process was done in 35 cycles. It started with initial denaturation (95°C for 5 minutes), denaturation (95°C for 30 seconds), annealing step (62.5°C for 35 seconds), and extension step (72°C for 40 seconds). Extension for 10 minutes at 72°C was used as the final extension step. The obtained PCR product (192-bp) was digested with HinfI. The PCR product was not cleaved by HinfI restriction enzyme in samples with AA genotype and a fragment with 192-bp was detected. Three fragments (192-bp, 104-bp, and 88-bp) were produced in the AC genotype after digestion of PCR products with HinfI, and 104-bp and 88-bp fragments were detected in the presence of the CC genotype (Figure 1).
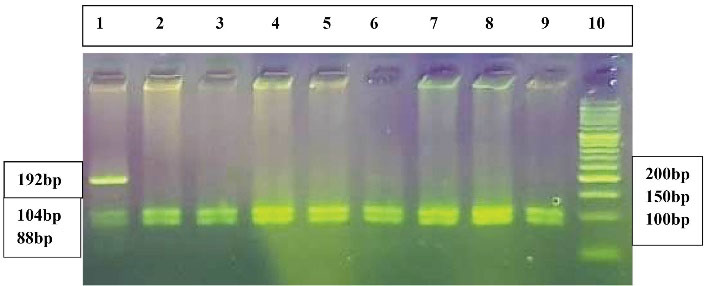
Figure 1.
The 3% Agarose Gel Electrophoresis of Amplified Keap1 Gene Digested with HinfI Restriction Enzyme. Lane 1 indicates the AC genotype. Lanes 2-9 demonstrate the CC genotype. Lane 10 shows the 50-bp DNA molecular weight marker
.
The 3% Agarose Gel Electrophoresis of Amplified Keap1 Gene Digested with HinfI Restriction Enzyme. Lane 1 indicates the AC genotype. Lanes 2-9 demonstrate the CC genotype. Lane 10 shows the 50-bp DNA molecular weight marker
Statistical Analysis
The SPSS version 16.0 was used for statistical analysis. The frequency of Keap1 genotypes was compared between two groups using the χ2 test and Pearson correlation coefficient. The values of quantitative parameters were compared between the two groups using t test. The analysis of variance (ANOVA) was used for comparing the anthropometrical parameters between three genotypes of Keap1. P < 0.05 was considered statistically significant.
Results
Anthropometry parameters of the studied subjects are depicted in Table 1. A total of 265 individuals including 131 controls with normal BMI (23 ± 1.8 kg/m2) and 134 obese subjects with a mean BMI of 35.7 ± 4.9 kg/m2(P < 0.001) were studied. Controls had a mean age of 38.9 ± 8.7 years and the mean age of obese individuals was 40.7 ± 10.2 years (P = 0.13). As shown in Table 1, the mean waist, hip, and wrist circumferences and waist-to-hip ratio in the obese group were significantly higher compared to controls. The mean serum level of triglycerides was 151.3 ± 86.9 in the obese group and it was 111.6 ± 56.5 mg/dL in the control group (P < 0.001). The mean LDL-C level was 126.7 ± 34.2 in the obese group and it was 105.9 ± 30.6 mg/dL in controls (P < 0.001). The mean serum HDL-C level was 44.7 ± 11.3 in obese individuals and it was 48.0 ± 11.8 mg/dL in controls (P = 0.02) (Table 1).
Table 1.
Characteristics of Obese Individuals and Controls With Normal BMI
|
Variables
|
Obese individuals (n=134)
Mean±SD
|
Controls (n=131)
Mean±SD
|
P
value
|
Age (years)
Range |
40.7 ± 10.2
20-59 |
38.9 ± 8.7
20-59 |
0.13 |
| BMI (kg/m2) |
35.7 ± 4.9 |
23 ± 1.8 |
< 0.001 |
| Waist circumference (cm) |
109.3 ± 11 |
83.9 ± 7.5 |
< 0.001 |
| Hip circumference (cm) |
119.8 ± 9.5 |
97.2 ± 4.8 |
< 0.001 |
| Wrist circumference (cm) |
17.8 ± 1.2 |
16 ± 1.2 |
< 0.001 |
| Waist to hip ratio |
0.91 ± 0.07 |
0.86 ± 0.05 |
< 0.001 |
| Total cholesterol (mg/dl) |
182.6 ± 39.3 |
174 ± 38.5 |
0.07 |
| Triglycerides (mg/dl) |
151.3 ± 86.9 |
111.6 ± 56.5 |
< 0.001 |
| HDL-C (mg/dl) |
44.7 ± 11.3 |
48 ± 11.8 |
0.02 |
| LDL-C (mg/dl) |
126.7 ± 34.2 |
105.9 ± 30.6 |
< 0.001 |
HDL-C: high-density lipoprotein cholesterol, LDL-C: low-density lipoprotein cholesterol.
Characteristics of obese individuals and controls according to the gender are demonstrated in Table 2. Waist, hip, and wrist circumferences and the mean waist-to-hip ratio in both males and females in the obese group were significantly higher compared to those in the controls (Table 2). The mean serum level of total cholesterol in obese males was significantly higher than that in males with normal BMI. The mean serum level of triglycerides in both obese males and females was significantly higher than in males and females with normal BMI. Additionally, the LDL-C level in both obese males and females was significantly higher compared to males and females with normal BMI. However, the serum level of HDL-C in obese women was significantly lower than that in women with normal BMI (Table 2).
Table 2.
Characteristics of Obese Individuals and Controls According to Gender
|
Variables
|
Obese individuals (n=134)
Male=66, Female=68
Mean±SD
|
Controls (n=131)
Male=65, Female=66
Mean±SD
|
| Age (years) |
|
|
Male
Female |
40.6 ± 10.5, P = 0.37
40.7 ± 9.9, P = 0.22 |
38.7 ± 9.3
39.2 ± 8 |
| BMI (kg/m2) |
|
|
Male
Female |
34.4 ± 3.6, P < 0.001
37 ± 5.6, P < 0.001 |
23.4 ± 1.6
22.6 ± 1.9 |
| Waist circumference (cm) |
Male
Female |
112.6 ± 9.9, P < 0.001
106 ± 11, P < 0.001 |
88.4 ± 5.5
79.5 ± 6.6 |
| Hip circumference (cm) |
Male
Female |
117.1 ± 6.7, P < 0.001
122.5 ± 11, P < 0.001 |
98.6 ± 4.4
95.9 ± 4.8 |
| Wrist circumference (cm) |
Male
Female |
18.5 ± 0.85, P < 0.001
17.1 ± 1.1, P < 0.001 |
16.9 ± 0.87
15.2 ± 0.8 |
| Waist: hip ratio |
|
|
Male
Female |
0.96 ± 0.05, P < 0.001
0.87 ± 0.05, P < 0.001 |
0.89 ± 0.05
0.83 ± 0.05 |
| Total cholesterol (mg/dL) |
Male
Female |
188.3 ± 39.8, P = 0.003
177 ± 38.4, P = 0.61 |
167.8 ± 39.1
180 ± 37.1 |
| Triglycerides (mg/dL) |
|
Male
Female |
175.9 ± 101.3, P = 0.002
127.4 ± 62, P = 0.001 |
128.7 ± 61.7
94.8 ± 45.4 |
| HDL-C (mg/dL) |
|
Male
Female |
42.3 ± 9, P = 0.84
47.1 ± 9, P = 0.002 |
42 ± 8.2
54 ± 11.8 |
| LDL-C (mg/dL) |
|
|
Male
Female |
129.3 ± 36.9, P < 0.001
124.1 ± 31.4, P = 0.003 |
103.9 ± 31
107.8 ± 30.3 |
HDL-C: high-density lipoprotein cholesterol, LDL-C: low-density lipoprotein cholesterol.
Table 3 demonstrates the distribution of Keap1 rs11085735genotypes and alleles in obese individuals and subjects with normal BMI. The Keap1 AA genotype frequency was 1.5% in the obese group and it was 0% in the control group (P = 0.36). The A allele frequency was 4.9% in obese individuals and it was 3.1% in the controls (P = 0.28).
Table 3.
Distribution of Keap1 Genotypes and Alleles in Obese Individuals and Controls
|
Keap1 Parameters
|
Obese individuals
No. (%)
|
Controls
No. (%)
|
P
Value
|
| Genotypes |
|
|
0.36* |
| AA |
2 (1.5) |
0 (0) |
| AC |
9 (6.7) |
8 (6.1) |
| CC |
123 (91.8) |
123 (93.9) |
| Alleles |
|
|
0.28 |
| A |
13 (4.9) |
8 (3.1) |
| C |
255 (95.1) |
254 (96.9) |
*Overall P value comparing 3 genotypes.
Anthropometric and lipid parameters were studied among various genotypes of Keap1 in all studied individuals and in obese subjects that are indicated in Tables 4 and 5. As indicated in Tables 4 and 5, carriers of the AA genotype had a significantly higher BMI than the carriers of AC and CC genotypes considering all studied individuals. In addition, the carriers of the AA genotype had significantly higher waist circumference compared to carriers of the AC and CC genotypes among all individuals and obese people. Further, in the presence of AA genotype, a significantly higher hip circumference was detected in all studied subjects and obese individuals compared to AC and CC genotypes (Tables 4 and 5).
Table 4.
Association of Studied Parameters with Keap1 Genotypes in All Individuals
|
Variables
|
AA
|
AC
|
CC
|
Overall
P
Value
|
| BMI (kg/m2) |
40.9 ± 2.7 |
31.3 ± 9.3 |
29.2 ± 7.1 |
0.044 |
| Waist circumference (cm) |
122 ± 11.3 |
101.7 ± 19.8 |
96.2 ± 15.3 |
0.028 |
| Hip circumference (cm) |
131.5 ± 6.4 |
111.6 ± 17.2 |
108.3 ± 13.2 |
0.035 |
| Wrist circumference (cm) |
18.8 ± 1.1 |
17.2 ± 1.2 |
16.9 ± 1.5 |
0.13 |
| Waist-to-hip ratio |
0.93 ± 0.04 |
0.91 ± 0.07 |
0.88 ± 0.07 |
0.34 |
| Total cholesterol (mg/dL) |
146 ± 49.5 |
169.8 ± 27 |
179.2 ± 39.7 |
0.31 |
| Triglycerides (mg/dL) |
109 ± 11.3 |
123.4 ± 51 |
132.4 ± 77.7 |
0.81 |
| HDL-C (mg/dL) |
40 ± 17 |
45.1 ± 10.8 |
46.5 ± 11.7 |
0.66 |
| LDL-C (mg/dL) |
116 ± 52.3 |
111.8 ± 23.8 |
116.7 ± 34.6 |
0.84 |
HDL-C: high-density lipoprotein cholesterol, LDL-C: low-density lipoprotein cholesterol.
Table 5.
Association of Studied Parameters With Keap1 Genotypes in Obese Individuals
|
Variables
|
AA
|
AC
|
CC
|
Overall
P
value
|
| BMI (kg/m2) |
40.9 ± 2.7 |
38.6 ± 6.7 |
35.4 ± 4.7 |
0.052 |
| Waist circumference (cm) |
122 ± 11.3 |
116.2 ± 15.7 |
108.5 ± 10.3 |
0.031 |
| Hip circumference (cm) |
131.5 ± 6.4 |
124.9 ± 12.3 |
119.5 ± 9.1 |
0.048 |
| Wrist circumference (cm) |
18.8 ± 1.1 |
17.9 ± 1 |
17.7 ± 1.2 |
0.46 |
| Waist-to-hip ratio |
0.93 ± 0.04 |
0.93 ± 0.09 |
0.91 ± 0.07 |
0.73 |
| Total cholesterol (mg/dL) |
146 ± 49.5 |
167.1 ± 29.3 |
184.3 ± 39.7 |
0.19 |
| Triglycerides (mg/dL) |
109 ± 11.3 |
120.2 ± 39.2 |
154.3 ± 89.5 |
0.41 |
| HDL-C (mg/dL) |
40 ± 17 |
46.3 ± 12.7 |
44.7 ± 11.2 |
0.76 |
| LDL-C (mg/dL) |
116 ± 52.3 |
111.6 ± 26.9 |
127.9 ± 34.4 |
0.34 |
HDL-C: high-density lipoprotein cholesterol, LDL-C: low-density lipoprotein cholesterol.
Discussion
We detected abnormal lipid profile among obese individuals compared to controls. In other words, significantly higher levels of triglycerides and LDL-C and lower HDL-C levels were found in the obese group than the controls. Moreover, in obese men, total cholesterol level was significantly higher compared to the normal BMI group. However, a significantly lower level of HDL-C was found in obese women compared to controls. Obesity, especially the accumulation of visceral fat, enhances hypertension, dyslipidemia, and the risk of T2DM, contributes to cardiovascular diseases, reduces life quality, and increases medical care costs and premature mortality (22,23). Obesity induces metabolic syndrome complications and glucose and lipid metabolism disorders. It has been reported that obesity is associated with increased levels of total cholesterol, LDL-C, and TG and decreased HDL-C levels. Moreover, the increased prevalence of obesity is accompanied by an increase in the prevalence of diabetes and pre-diabetes (24).
The presence of the minor A allele of Keap1, rs11085735, results in the lower expression of Keap1, higher expression of Nrf2, and reduced overall survival of patients with breast cancer treated with tamoxifen and radiotherapy (19). The Nrf2- Keap1 system protects pancreatic beta cells against oxidative stress through multiple pathways and it is necessary for the control of glucose metabolism by the secretion of insulin and utilization of glucose in insulin-sensitive tissues (25). There is no available study to investigate the frequency and the effect of Keap1 gene polymorphism rs11085735 on the risk of obesity. In our study, a higher AA genotype frequency was observed in obese individuals than in controls, which was not significant. However, the Keap1 polymorphism affected the anthropometric parameters as the carriers of AA genotype had significantly higher BMI and waist and hip circumferences compared to the carriers of AC and CC genotypes.
In obese individuals, there is a redox imbalance and potentiated oxidative stress. The Nrf2- Keap1 pathway is necessary for the prevention of the metabolic dysregulation linked to obesity (26). During oxidative stress, Keap1 acts as a sensor of redox homeostasis and ROS reacts with Keap1 and modifies the Keap1 homodimer structure, resulting in Nrf2 release. After translocation into the nucleus, the released Nrf2 induces antioxidant response-related gene expression (26). Therefore, genetic variation in Nrf2 and its related genes could be associated with the development of obesity. The importance of Nrf2 in insulin resistance and obesity suggested the potential therapeutic use of Nrf2 activators (27).
Several studies indicated the association of BMI and T2DM with the increased risk of T2DM as the BMI exceeds 25 kg/m2. A systematic review of 18 weight-related diseases suggested that diabetes mellitus is one of the most widespread metabolic diseases and men with BMI ≥ 30 kg/m2 had a 7 times and women with BMI ≥ 30 kg/m2 had a 12 times higher risk of T2DM development than men and women with normal BMI (BMI ≤ 25 kg/m2) (6). Furthermore, fat distribution and the relative proportions of lipids in different insulin-sensitive tissues, skeletal muscle, adipose tissue, and liver play a major role in the pathophysiology of obesity.
Waist circumference, a measure of abdominal obesity, is considered a better predictor of T2DM. Insulin resistance along with the dysfunction of pancreatic β-cells is a risk factor for the development of T2DM (28).
One of the most important and dangerous forms of obesity is abdominal obesity. Intra-abdominal or visceral fat accumulation is the main characteristic of metabolic syndrome that is associated with a higher incidence of diabetes mellitus and cardiovascular disease (29).
The International Diabetes Federation has considered the gender effect on the waist circumference-based risk, by adding the ethnicity into the definition of central obesity as a metabolic syndrome component (30). Estimating the waist circumference has been the better anthropometric measurement of abdominal adiposity. Measurement of abdominal adiposity is useful for the assessment of insulin resistance and risks of coronary heart disease in various populations. Measurement of the waist circumference could be useful in identifying subjects at an increased risk of insulin resistance and coronary heart disease (31). Visceral fat accumulation increases pro-oxidant and pro-inflammatory states. Animal studies along with epidemiological, and clinical reports suggested that oxidative stress is involved in the pathogenesis of obesity and its associated risk factors (32).
Conclusion
Our study found an abnormal lipid profile in obese individuals compared to individuals with normal BMI. In the present study, a higher Keap1 AA genotype frequency was observed in obese individuals compared to controls, which was not significant. However, the Keap1 polymorphism influenced the anthropometric parameters and the carriers of Keap1 AA genotype had significantly higher BMI and waist and hip circumferences compared to the carriers of AC and CC genotypes.
Limitation of the Study
The use of a small sample size in studying the association of anthropometric and lipid profile parameters with the Keap1 AA genotype, due to the low frequency of this genotype, was the limitation of the study.
Acknowledgments
This study was done in partial fulfillment of the requirements for the PhD degree of Avan Arif Ahmad, Kermanshah University of Medical Sciences, Kermanshah, Iran.
Author Contributions
Conceptualization: Zohreh Rahimi.
Data curation: Avan Arif Ahmad, Zohreh Rahimi.
Formal Analysis: Zohreh Rahimi, Asad Vaisi-Raygani.
Funding acquisition: Avan Arif Ahmad, Zohreh Rahimi.
Investigation: Avan Arif Ahmad, Zohreh Rahimi.
Methodology: Avan Arif Ahmad, Zohreh Rahimi, Asad Vaisi-Raygani.
Project administration: Zohreh Rahimi.
Resources: Avan Arif Ahmad, Zohreh Rahimi.
Software: Zohreh Rahimi, Avan Arif Ahmad, Asad Vaisi-Raygani.
Supervision: Zohreh Rahimi.
Validation: Zohreh Rahimi, Avan Arif Ahmad.
Visualization: Zohreh Rahimi, Asad Vaisi-Raygani.
Writing – original draft: Zohreh Rahimi, Avan Arif Ahmad.
Writing – review & editing: Zohreh Rahimi, Avan Arif Ahmad, Asad Vaisi-Raygani.
Conflict of Interests
There are no conflicts of interest.
Ethical Issues
The research was performed according to the Helsinki Declaration. The study was approved by the Ethics Committee of Kermanshah University of Medical Sciences (IR.KUMS.REC.1400.7141). Written informed consent was obtained from all participants before the study. Authors have completely observed ethical issues such as data fabrication, plagiarism, and double publication.
Funding/Support
This study was financially supported by a grant from Vice Chancellor for Research of Kermanshah University of Medical Sciences, Kermanshah, Iran (Project number 4000245).
References
- Obesity: preventing and managing the global epidemic. Report of a WHO consultation. World Health Organ Tech Rep Ser. 2000;894:i-xii, 1-253.
- Ogden CL, Yanovski SZ, Carroll MD, Flegal KM. The epidemiology of obesity. Gastroenterology 2007; 132(6):2087-102. doi: 10.1053/j.gastro.2007.03.052 [Crossref] [ Google Scholar]
- Kelly T, Yang W, Chen CS, Reynolds K, He J. Global burden of obesity in 2005 and projections to 2030. Int J Obes (Lond) 2008; 32(9):1431-7. doi: 10.1038/ijo.2008.102 [Crossref] [ Google Scholar]
- Afshin A, Forouzanfar MH, Reitsma MB, Sur P, Estep K, Lee A. Health effects of overweight and obesity in 195 countries over 25 years. N Engl J Med 2017; 377(1):13-27. doi: 10.1056/NEJMoa1614362 [Crossref] [ Google Scholar]
- Go AS, Mozaffarian D, Roger VL, Benjamin EJ, Berry JD, Borden WB. Heart disease and stroke statistics--2013 update: a report from the American Heart Association. Circulation 2013; 127(1):e6-e245. doi: 10.1161/CIR.0b013e31828124ad [Crossref] [ Google Scholar]
- Guh DP, Zhang W, Bansback N, Amarsi Z, Birmingham CL, Anis AH. The incidence of co-morbidities related to obesity and overweight: a systematic review and meta-analysis. BMC Public Health 2009;9:88. Published 2009 Mar 25. 10.1186/1471-2458-9-88.
- Lefranc C, Friederich-Persson M, Palacios-Ramirez R, Nguyen Dinh Cat A. Mitochondrial oxidative stress in obesity: role of the mineralocorticoid receptor. J Endocrinol 2018; 238(3):R143-R59. doi: 10.1530/joe-18-0163 [Crossref] [ Google Scholar]
- Pischon T, Boeing H, Hoffmann K, Bergmann M, Schulze MB, Overvad K. General and abdominal adiposity and risk of death in Europe. N Engl J Med 2008; 359(20):2105-20. doi: 10.1056/NEJMoa0801891 [Crossref] [ Google Scholar]
- Alberti KG, Eckel RH, Grundy SM, Zimmet PZ, Cleeman JI, Donato KA. Harmonizing the metabolic syndrome: a joint interim statement of the International Diabetes Federation Task Force on Epidemiology and Prevention; National Heart, Lung, and Blood Institute; American Heart Association; World Heart Federation; International Atherosclerosis Society; and International Association for the Study of Obesity. Circulation 2009; 120(16):1640-5. doi: 10.1161/circulationaha.109.192644 [Crossref] [ Google Scholar]
- Rupérez AI, Gil A, Aguilera CM. Genetics of oxidative stress in obesity. Int J Mol Sci 2014; 15(2):3118-44. doi: 10.3390/ijms15023118 [Crossref] [ Google Scholar]
- Akin-Bali DF, Eroglu T, Ilk S, Egin Y, Kankilic T. Evaluation of the role of Nrf2/Keap1 pathway-associated novel mutations and gene expression on antioxidant status in patients with deep vein thrombosis. Exp Ther Med 2020; 20(2):868-81. doi: 10.3892/etm.2020.8790 [Crossref] [ Google Scholar]
- Lee JM, Li J, Johnson DA, Stein TD, Kraft AD, Calkins MJ. Nrf2, a multi-organ protector?. FASEB J 2005; 19(9):1061-6. doi: 10.1096/fj.04-2591hyp [Crossref] [ Google Scholar]
- Smith RE, Tran K, Smith CC, McDonald M, Shejwalkar P, Hara K. The role of the Nrf2/ARE antioxidant system in preventing cardiovascular diseases. Diseases 2016; 4(4):34. doi: 10.3390/diseases4040034 [Crossref] [ Google Scholar]
- Kim J, Cha YN, Surh YJ. A protective role of nuclear factor-erythroid 2-related factor-2 (Nrf2) in inflammatory disorders. Mutat Res 2010; 690(1):12-23. doi: 10.1016/j.mrfmmm.2009.09.007 [Crossref] [ Google Scholar]
- Furukawa M, Xiong Y. BTB protein Keap1 targets antioxidant transcription factor Nrf2 for ubiquitination by the Cullin 3-Roc1 ligase. Mol Cell Biol 2005; 25(1):162-71. doi: 10.1128/mcb.25.1.162-171.2005 [Crossref] [ Google Scholar]
- Taguchi K, Motohashi H, Yamamoto M. Molecular mechanisms of the Keap1–Nrf2 pathway in stress response and cancer evolution. Genes Cells 2011; 16(2):123-40. doi: 10.1111/j.1365-2443.2010.01473.x [Crossref] [ Google Scholar]
- Deshmukh P, Unni S, Krishnappa G, Padmanabhan B. The Keap1-Nrf2 pathway: promising therapeutic target to counteract ROS-mediated damage in cancers and neurodegenerative diseases. Biophys Rev 2017; 9(1):41-56. doi: 10.1007/s12551-016-0244-4 [Crossref] [ Google Scholar]
- Siedlinski M, Postma DS, Boer JM, van der Steege G, Schouten JP, Smit HA. Level and course of FEV1 in relation to polymorphisms in NFE2L2 and KEAP1 in the general population. Respir Res 2009; 10(1):73. doi: 10.1186/1465-9921-10-73 [Crossref] [ Google Scholar]
- Hartikainen JM, Tengström M, Winqvist R, Jukkola-Vuorinen A, Pylkäs K, Kosma VM. KEAP1 genetic polymorphisms associate with breast cancer risk and survival outcomes. Clin Cancer Res 2015; 21(7):1591-601. doi: 10.1158/1078-0432.ccr-14-1887 [Crossref] [ Google Scholar]
- dbSNP database. Available from: https://www.ncbi.nlm.nih.gov/snp/rs11085735.
- Khalili F, Vaisi-Raygani A, Shakiba E, Kohsari M, Dehbani M, Naseri R. Oxidative stress parameters and keap 1 variants in T2DM: Association with T2DM, diabetic neuropathy, diabetic retinopathy, and obesity. J Clin Lab Anal 2022; 36(1):e24163. doi: 10.1002/jcla.24163 [Crossref] [ Google Scholar]
- Centers for Disease Control and Prevention (CDC). Statespecific prevalence of obesity among adults--United States, 2007. MMWR Morb Mortal Wkly Rep. 2008;57(28):765-8.
- Kopelman PG. Obesity as a medical problem. Nature 2000; 404(6778):635-43. doi: 10.1038/35007508 [Crossref] [ Google Scholar]
- Almari M, Mohammad A, Abubaker J, Ziyab AH. Obesity and prediabetes are jointly associated with lipid abnormalities among adolescents: a cross-sectional study. Diabetes Metab Syndr Obes 2021; 14:345-53. doi: 10.2147/dmso.s290383 [Crossref] [ Google Scholar]
- Tu W, Wang H, Li S, Liu Q, Sha H. The anti-inflammatory and anti-oxidant mechanisms of the Keap1/Nrf2/ARE signaling pathway in chronic diseases. Aging Dis 2019; 10(3):637-51. doi: 10.14336/ad.2018.0513 [Crossref] [ Google Scholar]
- Zhang Z, Zhou S, Jiang X, Wang YH, Li F, Wang YG. The role of the Nrf2/Keap1 pathway in obesity and metabolic syndrome. Rev Endocr Metab Disord 2015; 16(1):35-45. doi: 10.1007/s11154-014-9305-9 [Crossref] [ Google Scholar]
- Li S, Eguchi N, Lau H, Ichii H. The role of the Nrf2 signaling in obesity and insulin resistance. Int J Mol Sci 2020; 21(18):6973. doi: 10.3390/ijms21186973 [Crossref] [ Google Scholar]
- Manna P, Jain SK. Obesity, Oxidative stress, adipose tissue dysfunction, and the associated health risks: causes and therapeutic strategies. Metab Syndr Relat Disord 2015; 13(10):423-44. doi: 10.1089/met.2015.0095 [Crossref] [ Google Scholar]
- Ravensbergen HR, Lear SA, Claydon VE. Waist circumference is the best index for obesity-related cardiovascular disease risk in individuals with spinal cord injury. J Neurotrauma 2014; 31(3):292-300. doi: 10.1089/neu.2013.3042 [Crossref] [ Google Scholar]
- Alberti KG, Zimmet P, Shaw J. Metabolic syndrome--a new world-wide definition A Consensus Statement from the International Diabetes Federation. Diabet Med 2006; 23(5):469-80. doi: 10.1111/j.1464-5491.2006.01858.x [Crossref] [ Google Scholar]
- Steele AM, Shields BM, Knight B, Pearson ER. Waist circumference: a predictive tool for insulin resistance. J Diabetes Nurs 2005; 9(10):89-393. [ Google Scholar]
- Savini I, Catani MV, Evangelista D, Gasperi V, Avigliano L. Obesity-associated oxidative stress: strategies finalized to improve redox state. Int J Mol Sci 2013; 14(5):10497-538. doi: 10.3390/ijms140510497 [Crossref] [ Google Scholar]