Avicenna Journal of Medical Biochemistry. 10(2):90-94.
doi: 10.34172/ajmb.2022.2392
Original Article
Association of 25 (OH)-D3 Level With the CYP27B1 rs10877012 Variants and Metabolic Parameters in T2DM Patients From Kurdistan, Iraq
Shna Ahmed Mohhamed 1, 3  , Zohreh Rahimi 1, 2, * , Ebrahim Shakiba 1, Fatemeh Khadir 3, Maryam Kohsari 3
Author information:
1Department of Clinical Biochemistry, Medical School, Kermanshah University of Medical Sciences, Kermanshah, Iran
2Medical biology Research Center, Medical School, Kermanshah University of Medical Sciences, Kermanshah, Iran
3Student Research Committee, Kermanshah University of Medical Sciences, Kermanshah, Iran
Abstract
Background: There is an increasing prevalence of type 2 diabetes mellitus (T2DM) worldwide. The deficiency of vitamin D is a worldwide health problem that can increase susceptibility to T2DM. Cytochrome P450 family 27 subfamily B member 1 (CYP27B1) encodes the enzyme 1α-hydroxylase in the kidney, which converts 25 (OH)-D3 to 1,25 (OH)2-D3. The CYP27B1 rs10877012 G/T polymorphism is located in the gene promoter and can influence vitamin D3 level.
Objectives: This study aimed to investigate the relationship between CYP27B1 gene polymorphism and the 25 (OH)-D3 serum level and the risk of T2DM. Additionally, the effect of 25 (OH)-D3 level on metabolic parameters was investigated.
Methods: We investigated 310 individuals including 205 T2DM patients and 105 healthy subjects from the city of AL-Sulaymaniyah, Kurdistan of Iraq. The CYP27B1 gene variants were identified by the polymerase chain reaction followed by digestion with HinfI restriction enzyme.
Results: The mean level of 25 (OH)-D3 was 18.4±8.5 ng/mL in T2DM patients and 24.1±9.3 ng/mL in healthy controls (P<0.001). Significantly higher body mass index (BMI), HbA1c level, and fasting blood sugar concentration were detected in individuals with vitamin D insufficiency (P=0.009, P=0.001, and P=0.01, respectively) and vitamin D deficiency (P=0.025, P<0.001, and P<0.001, respectively) compared to those with a sufficient level of vitamin D. The T allele frequency of CYP27B1 was 38.1% in controls and 40.2% in patients (P=0.6). In the presence of the GT genotype, a significantly lower level of 25 (OH)-D3 was obtained compared to the GG genotype (P=0.02) among the patients.
Conclusion: We found that the CYP27B1 rs10877012 polymorphism was not a risk factor for T2DM but it affected the level of 25 (OH)-D3 in diabetic patients and vitamin D deficiency and insufficiency increased the values of BMI, HbA1c, and FBS as the metabolic parameters involved in the development of T2DM.
Keywords: Type 2 diabetes mellitus, Cytochrome P450 family 27 subfamily B member 1 gen, Vitamin D3, Metabolic parameters,
Copyright and License Information
© 2022 The Author(s); Published by Hamadan University of Medical Sciences.
This is an open-access article distributed under the terms of the Creative Commons Attribution License (
http://creativecommons.org/licenses/by/4.0), which permits unrestricted use, distribution, and reproduction in any medium provided the original work is properly cited.
Please cite this article as follows: Mohhamed SA, Rahimi Z, Shakiba E, Khadir F, Kohsari M. Association of 25 (OH)-D3 level with the CYP27B1 rs10877012 variants and metabolic parameters in T2DM patients from kurdistan, iraq. Avicenna J Med Biochem. 2022; 10(2):90- 94. doi:10.34172/ajmb.2022.2392
Background
Type 2 diabetes mellitus (T2DM) is characterized by impaired insulin secretion from beta cells of the pancreas as well as peripheral tissue resistance to insulin. This metabolic disease originates from an interplay between genetic background and lifestyle (1). T2DM usually occurs in individuals older than 45 years; however, with increasing obesity, physical inactivity, and energy-dense diets, T2DM is now observed in children, adolescents, and younger adults (2).
Vitamin D deficiency is a worldwide health problem. Some diseases such as obesity and T2DM could be connected to vitamin D deficiency (3). There is a hypothesis about the positive association between serum level of 25(OH)-D3 and obesity (4). However, the 25 (OH)-D3 level was inversely correlated to HbA1c level in subjects without a history of diabetes mellitus (5). Additionally, among Asians with T2DM and end-stage renal disease (ESRD), lower serum 25 (OH)-D3 level was correlated with poorer glycaemic control (6). It has been suggested that a decline in 25 (OH)-D3 level resulted in worse beta-cell function (6) and that the active form of vitamin D regulates the insulin response to increased levels of blood glucose by binding to its receptor in β-cells of the pancreas (5).
Vitamin D is a fat-soluble vitamin. The vitamin D metabolic pathway includes its hydroxylation in the liver by cytochrome (CYP) 2R1 hydroxylase at carbon 25 that results in 25 (OH)-D3 production. The cytochrome P450 family 27 subfamily B member 1/1α-hydroxylase (CYP27B1) encodes the enzyme 1α-hydroxylase in the kidney, which converts 25 (OH)-D3 to 1,25 (OH)2-D3, the active form of vitamin D. The major circulating form of vitamin D is 25 (OH)-D3 (7,8).
Genetic variation has an important role in the differences in the circulating levels of 25 (OH)-D between individuals. The CYP27B1 gene is located on chromosome 12, 12q14.1, and has 9 exons. The enzyme 1α-hydroxylase is encoded by a gene that is classified in the mitochondrial cytochrome P450 family of enzymes. The CYP27B1rs10877012 polymorphism is located in the gene promoter. The G allele is the reference allele and the T allele is the alternative allele. The CYP27B1 polymorphism could influence vitamin D3 level (9). The overall frequency of the minor T allele of the CYP27B1 polymorphism is 26.23%, with different frequencies in various populations. The T allele frequency (minor allele) is around 29% in Europeans, 65% in Asians, and 39% in South Asians. This polymorphism did not affect a codon (amino acid) (10). However, this polymorphism is located in the promotor region and its location may affect the transcription and translation processes (9). Previously, we reported a frequency of 34% for this allele among healthy pregnant women from Western Iran with Kurdish ethnic background (7).
The aim of this study was to find whether this polymorphism in CYP27B1, a gene that encodes the biosynthesis of the active form of vitamin D, is associated with the serum level of 25 (OH)-D3 and the risk of T2DM. Moreover, we aimed to find the effect of 25 (OH)-D3 on metabolic parameters.
Materials and Methods
Subjects
We studied 310 individuals (157 males and 153 females) from the city of AL-Sulaymaniyah, Kurdistan of Iraq. The participants consisted of 205 patients with T2DM who referred to Kidney Care Centre, Sulaimaniyah Endocrine and Diabetes Center, Public Health Laboratory, and Sulaymaniyah Shar hospital in Sulaymaniyah and 105 gender- and age-matched healthy individuals. Blood samples were obtained from all the participants from June to December 2021. Controls were healthy individuals without a history of diabetes mellitus, chronic kidney disease, hypertension, cardiovascular, cancer, and thyroid diseases and individuals who did not consume vitamin D supplements in the last three months.Diabetes was diagnosed based on the guideline of the World Health Organization (WHO). Participants with a fasting plasma sugar (FBS) level higher than 126 mg/dL after an overnight fasting and plasma glucose concentration higher than 200 mg/dL 2 hours after a 75 g oral glucose load were considered diabetic (11).
Collection of Blood Samples
First, 5 mL of fasting venous blood was obtained from each participant. Blood samples were separated into two parts. The first part (3 mL) was collected in a gel tube, allowed to clot for 15 minutes at room temperature, and separated by centrifugation at 5000 rpm for 10 minutes. The serum sample of each participant was removed with an automated pipette and was poured in an aliquot tube to preserve and deep freeze until use for estimation of biochemical parameters. Then, 2 mL of whole blood was collected in an EDTA tube for genetic analysis. Whole blood was stored at - 40°C and transferred to Kermanshah in a freezing state. DNA was extracted from whole blood by the phenol-chloroform method for the detection of CYP27B1 rs10877012 genotypes.
Biochemical Assessment
Fasting blood glucose was measured by the standard enzymatic method using an automated chemical analyzer (Cobas c311, Germany). Vitamin D status was evaluated by measuring the serum 25 (OH)-D3 level using a Cobas e411 analyzer that uses a potent electrochemiluminescence technology for immunoassay analysis. The 25 (OH)‐D3 level higher than 50 nmol/L (20 ng/mL) was considered an adequate level of vitamin D. Vitamin D insufficiency was defined as a serum 25 (OH)-D3 level between 30 and 50 nmol/L (12 to 20 ng/mL) and deficiency as a level less than 30 nmol/L (12 ng/mL) (12).
Genotyping
DNA was extracted from the whole blood using the phenol-chloroform method. The DNA concentration and purity were detected using the Nanodrop spectrophotometer, followed by the absorbance measurement at the wavelength of 260 nm and calculating the absorbance ratio of 260 to 280 nm, respectively.
The CYP 27B1 rs10877012 genotypes were identified by polymerase chain reaction followed by digestion with the HinfI restriction enzyme (13). The primers used for the amplification of CYP 27B1 rs10877012 were the forward primer of 5’ GCC TGT AGT GCC TTG AGA GG 3’ and the reverse primer of 5’ CAG TGG GGA ATG AGG GAG TA 3’. In the presence of TT genotype, the 187-bp PCR product remained intact. However, in the presence of GG genotype, the 187-bp PCR product was digested into two fragments of 138- and 49-bp. The GT genotype was identified in the presence of 3 fragments of 187-, 138-, and 49-bp (Figure 1) (13).
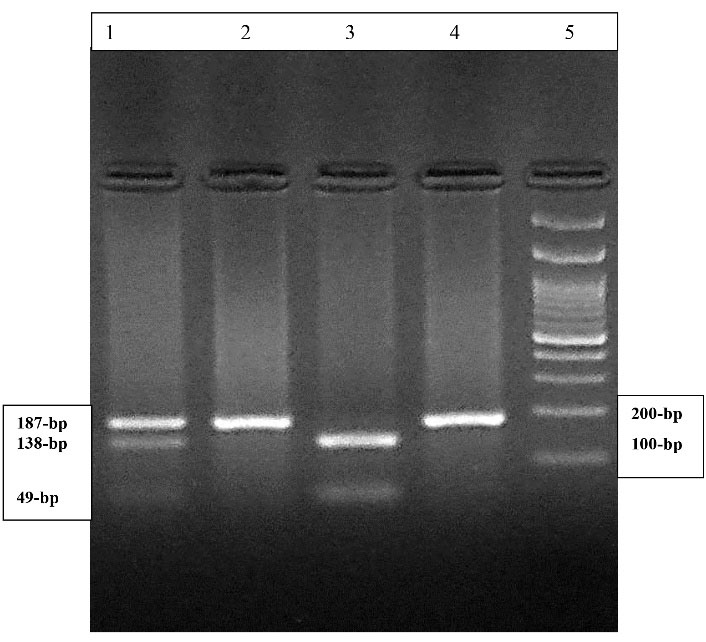
Figure 1.
The 3% Agarose Gel Electrophoresis of Amplified CYP27B1 Gene Digested With HinfI Restriction Enzyme. Lane 1 indicates the GT genotype. Lanes 2 and 4 demonstrate the TT genotype. Lane 3 shows GG genotype. Lane 5 shows the 100-bp DNA molecular weight marker.
.
The 3% Agarose Gel Electrophoresis of Amplified CYP27B1 Gene Digested With HinfI Restriction Enzyme. Lane 1 indicates the GT genotype. Lanes 2 and 4 demonstrate the TT genotype. Lane 3 shows GG genotype. Lane 5 shows the 100-bp DNA molecular weight marker.
Statistical Analysis
The allelic frequencies were calculated using the chromosome counting method. Genotype and allele frequencies of CYP27 B1 were compared between the study groups using the χ2 test. Quantitative data were compared between groups using a two-tailed student’s t-test and the analysis of variance (ANOVA) test. Statistical analysis was performed using the SPSS version 16.0. P values of less than 0.05 were considered statistically significant.
Results
Table 1 demonstrates the biochemical characteristics of the T2DM and control groups. The mean age was 53.7 ± 5.6 years in patients and it was 52.5 ± 5.1 years (P = 0.06) in controls. The mean level of 25 (OH)-D3 was 18.4 ± 8.5 ng/mL in T2DM patients which was lower compared with healthy subjects (24.1 ± 9.3 ng/mL, P < 0.001) (Table 1). The mean BMI value was 30.6 ± 5.4 kg/m2 in diabetic patients compared to 28.2 ± 5 kg/m2 in healthy individuals (P < 0.001).
Table 1.
Characteristics of the Participants
|
Variables
|
Patients with T2DM
n=205
|
Controls
n=105
|
| Age (years) |
53.7 ± 5.6
P = 0.06 |
52.5 ± 5.1 |
| Diabetes duration (years) |
8.2 ± 5.5 |
- |
| BMI (kg/m2) |
30.6 ± 5.4
P < 0.001 |
28.2 ± 5 |
| 25 (OH)-D (ng/mL) |
18.4 ± 8.5
P < 0.001 |
24.1 ± 9.3 |
| Hb A1C (%) |
9.3 ± 2.3
P < 0.001 |
5.4 ± 0.41 |
| FBS (mg/dL) |
207.3 ± 82.1
P < 0.001 |
86.9 ± 9.6 |
BMI, body mass index; FBS, fasting blood sugar.
The values of BMI, HbA1c, and FBS in various vitamin D statuses are shown in Table 2. Significantly higher values of BMI, HbA1c, and FBS were detected in both individuals with vitamin D insufficiency (P = 0.009, P = 0.001, and P = 0.01, respectively) and vitamin D deficiency (P = 0.025, P < 0.001, and P < 0.001, respectively) than in individuals with a sufficient level of vitamin D (Table 2).
Table 2.
BMI, HbA1c, and FBS Values in Various Vitamin D Statuses
|
Variables
|
Individuals With Sufficient Vitamin D Level
(n=143)
|
Individuals With Vitamin D Insufficiency
(n=111)
|
Individuals With Vitamin D Deficiency
(n=56)
|
| BMI (kg/m2) |
28.6 ± 4.9 |
30.7 ± 5.8
P = 0.009 |
30.9 ± 5.7
P = 0.025 |
| Hb A1C (%) |
7.3 ± 2.4 |
8.4 ± 2.7
P = 0.001 |
8.9 ± 2.8
P < 0.001 |
| FBS (mg/dL) |
144 ± 78 |
175.3 ± 85.8
P = 0.01 |
206.4 ± 99.9
P < 0.001 |
BMI, body mass index; FBS, fasting blood sugar.
The T allele frequency of CYP27B1 was 38.1% in controls was 40.2% in patients (P = 0.6), as indicated in Table 3.
Table 3.
The Distribution of CYP 27B1 rs10877012 G > T Genotypes and Alleles among T2DM and Controls
|
Parameters
|
T2DM, n (%)
(n=205)
|
Controls, n (%)
(n=105)
|
| CYP genotypes |
|
|
| GG |
97 (47.3) |
57 (54.3) |
| GT |
83 (40.5) |
38 (36.2) |
| TT |
25 (12.2)
Overall χ2 = 1.44, P = 0.48 |
10 (9.5) |
| Alleles |
|
|
| G |
245 (59.8) |
130 (61.9) |
| T |
165 (40.2) |
80 (38.1)
χ2 = 0.26, P = 0.6 |
The values of the studied parameters were compared in various genotypes of the CYP 27B1 rs10877012 among all participants (Table 4) and also among the patients and controls, separately (Table 5). As depicted in Tables 4 and 5, in the presence of the GT genotype, significantly a lower level of 25 (OH)-D3 was obtained compared to the GG genotype (18.5 ± 8.4 versus 21.7 ± 9.5 ng/mL, P = 0.009 in all studied individuals and 16.5 ± 6.8 versus 19.9 ± 9.3 ng/mL, P = 0.02 in patients). However, in controls, there was no significant difference in the levels of 25 (OH)-D3 between various CYP27B1 genotypes (Table 5). In the presence of CYP TT genotype in all individuals and diabetic patients, higher levels of FBS and HbA1c were detected compared to the CYP GG genotype, with no statistically significant difference (Tables 4 and 5).
Table 4.
The Levels of Parameters according to the CYP 27B1 rs10877012 G > T Genotypes in the Participants
|
Parameters
|
GG, n=154
|
GT, n=121
|
TT, n=35
|
| BMI (kg/m2) |
29.6 ± 5.3 |
30.3 ± 6.0 P = 0.6 |
28.8 ± 4.2 P = 0.68 |
| 25 (OH)-D (ng/mL) |
21.7 ± 9.5 |
18.5 ± 8.4 P = 0.009 |
20.4 ± 0.9 P = 0.71 |
| Hb A1C (%) |
7.9 ± 2.7 |
8.0 ± 2.6 P = 0.92 |
8.5 ± 2.6 P = 0.58 |
| FBS (mg/dL) |
164.6 ± 90.9 |
164.7 ± 81.4 P = 1 |
181.1 ± 97.8 P = 0.57 |
BMI: body mass index; FBS: fasting blood sugar
Table 5.
The Levels of Parameters According to the CYP 27B1 rs10877012 G > T Genotypes in T2DM Patients and Controls
|
Parameters
|
GG
Patients (n=97)
Controls (n=57)
|
GT (
P
-value)
Patients (n=83)
Controls (n=38)
|
TT (
P
-value)
Patients (n=25)
Controls (n=10)
|
| BMI (kg/m2) |
|
|
|
| Patients |
30.5 ± 5.4 |
31.1 ± 6.1 (0.79) |
29 ± 3.7 (0.43) |
| Controls |
28 ± 4.8 |
28.5 ± 5.4 (0.91) |
28.1 ± 5.3 (0.99) |
| 25 (OH)-D (ng/mL) |
|
|
|
| Patients |
19.9 ± 9.3 |
16.5 ± 6.8 (0.02) |
18.9 ± 8.8 (0.4) |
| Controls |
24.9 ± 9.0 |
22.8 ± 10 (0.52) |
24.1 ± 8.9 (0.96) |
| Hb A1C (%) |
|
|
|
| Patients |
9.3 ± 2.4 |
9.1 ± 2.3 (0.84) |
9.7 ± 2.0 (0.71) |
| Controls |
5.3 ± 0.44 |
5.4 ± 0.33 (0.65) |
5.3 ± 0.54 (0.99) |
| FBS (mg/dL) |
|
|
|
| Patients |
209.8 ± 86.9 |
201.1 ± 73.3 (0.76) |
218 ± 92.4 (0.49) |
| Controls |
87.7 ± 9.9 |
85.1 ± 8.6 (0.38) |
88.8 ± 10.6 (0.94) |
BMI, body mass index; FBS, fasting blood sugar.
Among T2DM patients, there were 83 individuals (40.5%) with vitamin D insufficiency and 47 individuals (22.9%) with vitamin D deficiency compared to 28 (26.7%) and 9 (8.6%), (P < 0.001), respectively, in controls. A significantly lower frequency of CYP GT genotype (n = 29, 36.7%) was detected among patients with vitamin D deficiency than those with a sufficient level of vitamin D (n = 50, 63.3%, P = 0.025).
Discussion
The prevalence of T2DM is increasing due to lifestyle alterations. Besides, vitamin D deficiency is a worldwide health problem that is correlated to some diseases such as T2DM (3). In the present study, 25 (OH)-D3 level in T2DM patients was significantly lower than that in healthy controls and 87.5% of patients had vitamin D deficiency or insufficiency compared to 35.3% in healthy individuals. One of the major causative factors in the development of insulin resistance is vitamin D deficiency as the supplementation of vitamin D can improve the major metabolic factors related to insulin resistance (3). We found that vitamin D insufficiency and deficiency affected the metabolic parameters involved in the development of T2DM including BMI, HbA1c, and FBS that were significantly higher in individuals with vitamin D deficiency and also those with vitamin D insufficiency compared to subjects with a sufficient level of vitamin D. Vitamin D has a major role in many cellular processes and controls blood glucose concentration by controlling insulin secretion and sensitivity to insulin. An inverse correlation between the 25 (OH)-D3 level and the glycemic control in both subjects without a history of diabetes mellitus and patients with T2DM and ESRD has been reported (5,6). In the present study, the higher levels of FBS and Hb A1c in individuals with vitamin D deficiency and insufficiency compared to those with a sufficient level of vitamin D could be attributed to the adverse effect of decreased 25 (OH)-D3 level on beta cells function (6) and the dysregulation of insulin response and secretion to an enhanced blood glucose level in the presence of low level of 1, 25 (OH)2-D3 (5).
Vitamin D acts in adipose tissue, the major storage site of vitamin D, regulates lipid metabolism in adipose tissue, and controls adipocyte lipogenesis through non-genomic mechanisms (3). Moreover, vitamin D can affect lipogenesis and gluconeogenesis in the liver (3). In the present study, higher BMI was observed in the presence of vitamin D insufficiency and deficiency compared with the sufficient level of vitamin D that could result from abnormal adipocyte lipogenesis in the presence of low levels of vitamin D. There is conflicting evidence related to the low vitamin D level in T2DM; however, replacement of vitamin D has beneficial effects on incidence, control, and complications of diabetes mellitus (14).
Genetics has a key role in different levels of the circulating 25 (OH)-D3. We did not detect a significant difference in the distribution of the various genotypes and alleles of CYP27B1 G > T between T2DM patients and controls. The active form of vitamin D is 1,25 (OH)2-D3 that is produced by 1α-hydroxylase, an enzyme that is encoded by the CYP27B1 gene in the kidney, but its precursor (i.e., 25 (OH)-D3), which is the major and stable circulating form of vitamin D, is considered an indicator of vitamin D status (7). In the presence of the GT genotype compared to the GG genotype, a significantly lower 25 (OH)-D3 level was obtained among the patients in the present study. It was reported that among African Americans, common genetic variation in CYP27B1 rs10877012 polymorphism plays a role in determining 25 (OH)-D3 levels, with lower 25 (OH)-D3 level in the carriers of GG genotype than in the carriers of GT and TT genotypes (15). In addition, in a study from Brazil, in colorectal cancer patients, the level of 25 (OH)-D3 was significantly lower in the presence of the CYP27B1 rs10877012 GT + TT genotype compared to GG genotype (16). The results of the present study showed the influence of CYP27B1 polymorphism on vitamin D level. The higher levels of FBS and HbA1c found in the presence of CYP TT than CYP GG genotype were not significant, which might be due to the complex mechanisms of gene-gene and gene-environment interactions that need to be elucidated.
It seems that the CYP27B1 rs10877012 polymorphism can influence the 25 (OH)-D3 level. However, discrepancies can be observed under the effect of various genotypes of CYP27B1 polymorphism on the 25 (OH)-D3 level between various studies, which may be due to differences in the sample size, healthy individuals and/or patients, different frequencies of CYP27B1 gene variants in various populations, geographical factors, lifestyle, and individual variations.
Conclusion
The present study, for the first time, studied CYP27B1 rs10877012 polymorphism in relation to 25 (OH)-D3 level in T2DM patients compared to healthy individuals and detected that the CYP27B1 rs10877012 polymorphism is not a risk factor for T2DM but it can affect 25 (OH)-D3 level in diabetic patients. Moreover, we found vitamin D insufficiency and deficiency increased values of BMI, HbA1c, and FBS as the metabolic parameters involved in the development of T2DM.
Acknowledgments
This study was performed in partial fulfillment of the requirements for the Ph.D. degree of Shna Ahmed Mohhamed, Kermanshah University of Medical Sciences, Kermanshah, Iran.
Author Contributions
Conceptualization: Zohreh Rahimi.
Data curation: Shna Ahmed Mohhamed, Zohreh Rahimi, Fatemeh Khadir, Maryam Kohsari.
Formal Analysis: Shna Ahmed Mohhamed, Zohreh Rahimi, Maryam Kohsari, Fatemeh Khadir.
Funding acquisition: Zohreh Rahimi, Shna Ahmed Mohhamed.
Investigation: Zohreh Rahimi, Shna Ahmed Mohhamed.
Methodology: Shna Ahmed Mohhamed, Zohreh Rahimi, Fatemeh Khadir, Maryam Kohsari.
Project administration: Zohreh Rahimi, Ebrahim Shakiba.
Resources: Shna Ahmed Mohhamed, Zohreh Rahimi.
Software: Shna Ahmed Mohhamed, Zohreh Rahimi.
Supervision: Zohreh Rahimi.
Validation: Zohreh Rahimi, Shna Ahmed Mohhamed.
Visualization: Zohreh Rahimi.
Writing – original draft: Shna Ahmed Mohhamed, Zohreh Rahimi.
Writing – review & editing: Zohreh Rahimi, Shna Ahmed Mohhamed, Ebrahim Shakiba.
Conflict of Interests
None.
Ethical Issues
This study was approved by the Ethics Committee of Kermanshah University of Medical Sciences (IR.KUMS.REC.1400.142), and it was conducted in accordance with the principles of the Declaration of Helsinki II. Informed written consent was obtained from all study subjects.
Funding/Support
This research received no external funding.
References
- Reed J, Bain S, Kanamarlapudi V. A review of current trends with type 2 diabetes epidemiology, aetiology, pathogenesis, treatments and future perspectives. Diabetes Metab Syndr Obes 2021; 14:3567-602. doi: 10.2147/dmso.s319895 [Crossref] [ Google Scholar]
- Goyal R, Jialal I. Diabetes mellitus type 2. In: StatPearls. Treasure Island, FL: StatPearls Publishing; 2022. Available from: http://www.ncbi.nlm.nih.gov/books/NBK513253/.
- Szymczak-Pajor I, Drzewoski J, Śliwińska A. The molecular mechanisms by which vitamin D prevents insulin resistance and associated disorders. Int J Mol Sci 2020; 21(18):6644. doi: 10.3390/ijms21186644 [Crossref] [ Google Scholar]
- Ghavam S, Hafezi Ahmadi MR, Davar Panah A, Kazeminezhad B. Evaluation of HbA1C and serum levels of vitamin D in diabetic patients. J Family Med Prim Care 2018; 7(6):1314-8. doi: 10.4103/jfmpc.jfmpc_73_18 [Crossref] [ Google Scholar]
- Zhao H, Zhen Y, Wang Z, Qi L, Li Y, Ren L. The relationship between vitamin D deficiency and glycated hemoglobin levels in patients with type 2 diabetes mellitus. Diabetes Metab Syndr Obes 2020; 13:3899-907. doi: 10.2147/dmso.s275673 [Crossref] [ Google Scholar]
- Lim LL, Ng YM, Kang PS, Lim SK. Association between serum 25-hydroxyvitamin D and glycated hemoglobin levels in type 2 diabetes patients with chronic kidney disease. J Diabetes Investig 2018; 9(2):375-82. doi: 10.1111/jdi.12696 [Crossref] [ Google Scholar]
- Ghorbani Z, Shakiba M, Rezavand N, Rahimi Z, Vaisi-Raygani A, Rahimi Z. Gene variants and haplotypes of vitamin D biosynthesis, transport, and function in preeclampsia. Hypertens Pregnancy 2021; 40(1):1-8. doi: 10.1080/10641955.2020.1849274 [Crossref] [ Google Scholar]
- Alathari BE, Sabta AA, Kalpana CA, Vimaleswaran KS. Vitamin D pathway-related gene polymorphisms and their association with metabolic diseases: a literature review. J Diabetes Metab Disord 2020; 19(2):1701-29. doi: 10.1007/s40200-020-00561-w [Crossref] [ Google Scholar]
- Latacz M, Snarska J, Kostyra E, Wroński K, Fiedorowicz E, Savelkoul H. CYP27B1 gene polymorphism rs10877012 in patients diagnosed with colorectal cancer. Nutrients 2020; 12(4):998. doi: 10.3390/nu12040998 [Crossref] [ Google Scholar]
-
https://www.ncbi.nlm.nih.gov/snp/rs10877012.
- World Health Organization, International Diabetes Federation. Definition and diagnosis of diabetes mellitus and intermediate hyperglycaemia: report of a WHO/IDF consultation. World Health Organization; 2006. Available from: https://apps.who.int/iris/handle/10665/43588.
- Rezavand N, Tabarok S, Rahimi Z, Vaisi-Raygani A, Mohammadi E, Rahimi Z. The effect of VDR gene polymorphisms and vitamin D level on blood pressure, risk of preeclampsia, gestational age, and body mass index. J Cell Biochem 2019; 120(4):6441-8. doi: 10.1002/jcb.27934 [Crossref] [ Google Scholar]
- Falleti E, Cmet S, Fabris C, Fattovich G, Cussigh A, Bitetto D. Genetic polymorphisms of vitamin D pathway predict antiviral treatment outcome in slow responder naïve patients with chronic hepatitis C. PLoS One 2013; 8(11):e80764. doi: 10.1371/journal.pone.0080764 [Crossref] [ Google Scholar]
- Issa CM. Vitamin D and type 2 diabetes mellitus. Adv Exp Med Biol 2017; 996:193-205. doi: 10.1007/978-3-319-56017-5_16 [Crossref] [ Google Scholar]
- Signorello LB, Shi J, Cai Q, Zheng W, Williams SM, Long J. Common variation in vitamin D pathway genes predicts circulating 25-hydroxyvitamin D levels among African Americans. PLoS One 2011; 6(12):e28623. doi: 10.1371/journal.pone.0028623 [Crossref] [ Google Scholar]
- Marques Vidigal V, Aguiar Junior PN, Donizetti Silva T, de Oliveira J, Marques Pimenta CA, Vitor Felipe A. Genetic polymorphisms of vitamin D metabolism genes and serum level of vitamin D in colorectal cancer. Int J Biol Markers 2017; 32(4):e441-e6. doi: 10.5301/ijbm.5000282 [Crossref] [ Google Scholar]