Avicenna Journal of Medical Biochemistry. 9(1):1-7.
doi: 10.34172/ajmb.2021.01
Research Article
Glycemic Index and Glycemic Load of Four Local Fruits of Benin Among Apparently Healthy Young Adult Subjects
Moutawakilou Gomina 1, 2, *  , Edwige Lawin 1, Tarik Salifou 1, Gilbert Djidonou 2, Stanislas Zinsou 2
Author information:
1Unit for Training & Research in Biochemistry, Faculty of Medicine, University of Parakou, Benin
2Laboratory of Biochemistry, Parakou Teaching Hosital, Parakou, Benin
*
Corresponding author: Moutawakilou Gomina, Unit for Training & Research in Biochemistry, Faculty of Medicine, University of Parakou, Benin. Email:
elboutraguero@yahoo.fr
Abstract
Background: Daily consumption of fruits is recommended due to their positive impact on the control of glycemia, cholesterol and coronary heart disease. Objectives: This study aimed to determine the glycemic index and glycemic load (GL) of four local fruits grown in Benin, namely papaya, pineapple, watermelon and grafted mango, among apparently healthy young adult subjects.
Methods: This research work, being an interventional study of quasi-experimental category, involved 33 voluntary adult subjects (mean age: 23.4±1.9 years; mean body mass index: 21.38±1.89 kg/m2 ) distributed into 4 groups. The subjects of each group consumed the reference food (25 g of glucose or 50 g of white bread) twice a week with an interval of one week, and then a serving equivalent to 25 g of carbohydrates of each tested fruit in the morning after a 12-hour fasting on the evening. Plasma glucose was measured at 0, 15, 30, 45, 60, 90, and 120 minutes after food ingestion. Data were analyzed by one-way analysis of variance (ANOVA, SPSS, 26). The P < 0.05 was regarded as the significance level.
Results: The incremental area under the curve mean value in mmol.L-1.min-1 of pineapple (89.21±21.75) was higher (P <0.001) than those of mango (34.71±13.62), papaya (23.46±15.06) and watermelon (20.30±16.47). The mean glycemic index of mango (117.09±58.32) was significantly higher (P =0.007) than the ones of pineapple (52.97±29.87), papaya (46.77±45.77), and watermelon (41.04±34.06). The mean GL of mango (16.28±8.11) was significantly more elevated (P =0.001) than the ones of papaya (3.41±3.34), pineapple (6.36±3.58), and watermelon (2.54±2.11).
Conclusion: Watermelon, papaya and pineapple may therefore be recommended for safe consumption in accordance with dietary guidelines.
Keywords: Glycemic index, Glycemic load, Incremental area under the curve, Fruits, Benin
Copyright and License Information
© 2021 The Author(s); Published by Hamadan University of Medical Sciences.
This is an open-access article distributed under the terms of the Creative Commons Attribution License (
http://creativecommons.org/licenses/by/4.0), which permits unrestricted use, distribution, and reproduction in any medium provided the original work is properly cited.
Background
There is an increasing prevalence of chronic non-communicable diseases across the world which contributes to premature deaths due to changes in nutrition and lifestyle. Various prevention and control strategies have been developed in order to stop or delay their spread (1-3).
Three decades ago, the concept of dietary glycemic index (GI), proposed by a team of researchers from the University of Torontofor the first time, was discussed as a factor likely to help prevent chronic diseases (4). Dietary GI is a categorization based on the effect of content and type of carbohydrates in a foodon blood glucose level (5). It is a notion that is used to compare the glycemic responses of different high-carbohydrate foods(5). GI is therefore seen as a nutritional and clinical indicator, which is effective for the physiological classification of carbohydrate foods depending on their impact on postprandial blood glucose level. This classification of foods based on their GI provides guidance and directions for food choices within the framework of treatment and prevention of metabolic diseases (6). Recent studies have shown that a high-GI diet may increase the risk for cardiovascular diseases (CVDs) (7,8), and type 2 diabetes (9,10). However, it has been suggested that low-GI dietsyield benefits onglycemic control among patients with diabetes (11-13), and may contribute to reduce the body weight (14) as well as the risk for CVDs (8,11,15).
In addition to GI, the amount of carbohydrates in a food is also considered as a major determinant of fasting glucose tolerance and postprandial glycemic response. The glycemic load (GL) of a food, which is a measurement involving the amount and quality of dietary carbohydrates, helps get a better assessment of foods’ hyperglycemic effect (16).
Fruits play an important role during food intake assessment according to the international guidelines for healthy diet. Their daily consumption is recommended since they may have a positive impact on glycemic controland cholesterol, and help reduce the risk for coronary disease (2,17,18). In general, recommended intakes of fruits are based on their concentration of vitamins, minerals, and fibers, while little attention is given to their glycemic effect. If several research works focused on indigenous fruits or thosegrown in Europe, America, Asia, and South Africa, very few studies related to fruits native to sub-Saharan Africa have been reported in the recent literature.
In Benin, a wide variety of fruits is abundantly grown throughout the whole year and marketed for consumption. Benin’s food pyramid recommends including 2 to 3 servings of fruits in the diet per day but, to the best of our knowledge, any data on the glycemic response of these fruits has not yet been published. This study aimed to determine the GI and GL of four local fruits (i.e. watermelon, papaya, pineapple and mango) growing in Benin among apparently healthy young adult subjects in order to improve the nutritional quality of foods for the benefit of Benin population.
Methods
Tested Fruits and Reference Foods
Four ripe fruits grown in Benin were tested: watermelon variety with red flesh, papaya « solo » variety, pineapple “Sugar loaf” variety, and mango “Alphonso” variety. These fruits were bought in the markets of Parakou, and then identified at the Botany Laboratory of the Faculty of Agricultural Sciences of the University of Parakou (Dr. Honoré BIAOU, CAMES Senior Lecturer).
Reference foods used in this study were pure glucose (dextrose anhydrous purified LOBA Chemie LOT SL 29541112) and white bread.
Type and Period of Study
This research work is an interventional study of quasi-experimental category. The data used in this study were collected from February 1 to March 31, 2020.
Study Target Population
It consisted of young adult subjects selected after their informed, read, and approved consent. They were medicine students enrolled in the University of Parakou, regardless of sex.
This study included young volunteer subjects aged 18 to 30 years; they were non-smokers, and had a baseline biological test(fasting blood glucose, serum creatinine, aspartate transaminase [AST] and alanine transaminase [ALT]) and normal physical features(body mass index, blood pressure). The study did not include subjects who did not give their informed consent, those with overweight or obesity, diabetes, high blood pressure, on diet or any type of drug therapy, family history of diabetes mellitus or impaired glucoregulation, pregnant or breastfeeding women, those suffering from a liver disease or pancreatitis, those presenting hemostasis disorders, personal history of peptic or duodenal ulceror gastritis, or suffering from a protein-losing enteropathy. The study excluded the subjects presenting with side effects during the experiment or who did not want to participate in the study.
Detailed sociodemographic data, and family and personal medical history of the subjects were collected through interview. The anthropometric parameters were measured. Finally, blood samples were collected for baseline tests and fasting blood glucose, serum creatinine, AST, and ALT were performed. Only the subjects with anthropometric parameters and normal biological assessment were selected and signed the informed consent form.
Overall, 33 subjects were selected and distributed into four groups considering human model in order to carry out an experiment based on the criteria defined by WHO/FAO for conducting glycemic response studies (19). The subjects were distributed into groups as follows: group 1 (G1), 10 subjects; group 2 (G2), 7 subjects; group 3 (G3), 9 subjects; and group 4 (G4), 7 subjects.
Experimental Procedure
The selected subjects followed, three times, the study protocol (two tests replicated for reference food and one trial for fruits) in the morning after a fasting of 8 to 12 hours overnight. The reference food test was replicated once in order to get at least two values in each subject; accuracy was, therefore, improved (5). The subjects were recommended to have a standard carbohydrate diet and a normal physical activity, and not to take any type of medication on the eve of the experiment.
Two groups (G2 and G4) used white bread as reference food and the other two groups (G1 and G3) used glucose. Each subject attended the room prepared to serve the purpose of the study in the morning of the experiment day, at 8 am. After 10 to 15 minutes of rest, a venous catheter was put in place in one of the ulnar veins. After the ingestion of the reference food (glucose or white bread) or fruits designated for the test, blood samples (4 mL) were collected via the catheter into heparin tubes containing sodium fluoride from the first mouthful for baseline blood glucose test. The collection continued every 15 minutes during the first hour and then each 30 minutes during the second hour.
Each group had three sessions with a one-week interval between them. The first session was dedicated to the intake of 50 g of white bread (corresponding to 25 g of glucose) followed by 250 mL of tap water during 10 minutes for groups G2 and G4, or 25 g of pure glucose dissolved into 250 mL of water for groups G1 and G3; it was a session for reference food consumption. The second session was identical to the first one. The third session was dedicated to the consumption of one of the fruits investigated (corresponding to 25 g of carbohydrates) in ten minutes by each group of subjects. These were 342 g of papaya for G1, 180 g of orange pulp mango for G2, 208 g of sugar loaf pineapple for G3, and 403 g of watermelon for G4. All three sessions were subject to identical experimental conditions. The nutritional values of the tested fruits, drawn from the literature, are shown in Table 1.
Table 1.
Nutritional Values of Tested Fruits (
20)
|
Foods
|
Values for a Serving of 100 g
|
|
Energy (kcal)
|
Carbohydrates (g)
|
Fibers (g)
|
Watermelon
(Citrillus lanatus) |
29 |
6.2 |
0.3 |
Papaya
(Carica papaya) |
36 |
7.3 |
1.1 |
Mango with orange pulp
(Mangifera indica) |
64 |
13.9 |
2.1 |
Pineapple
(Ananas comosus) |
54 |
12.0 |
1.3 |
The blood samples collected during the experiment were centrifuged at 1500 g for 5 minutes, then decanted plasmas served for blood glucose measurement using end-point enzyme assay with glucose oxidase (21).
Data Processing
The software SPSS 26 (IBM corps, 2019) was used to perform data analysis and processing. Fruits’ GI was determined using the trapezoidal method (5). GL was calculated with the formula of Brouns et al (5). The findings were presented as ratios, mean values ± standard deviation, and medians. Student’s t test helped to compare the mean values of incremental areas under the curve calculated for each fruit and reference food. The analysis of variance (ANOVA) permitted to compare the calculated mean values of incremental areas under the curve, and the GIs and loads of the four fruits. Difference was significant if P< 0.05.
Results
General Characteristics of Study Subjects
Table 2 shows the general characteristics of the subjects involved in the study.
Table 2.
General Characteristics of Study Subjects
|
Parameters
|
|
| Mean age (y) |
23.24±1.89 |
| Weight (kg) |
60.61±5.91 |
| Height (m) |
1.69±0.09 |
| BMI (kg/m2) |
21.38±1.89 |
| Systolic BP (mm Hg) |
111.58±8.01 |
| Diastolic BP (mm Hg) |
72.27±6.00 |
| Fasting blood glucose (mmol/L) |
4.52±0.46 |
| Serum creatinine (mg/L) |
7.50±2.03 |
| AST (U/L) |
18.85±5.60 |
| ALT (U/L) |
18.33±5.02 |
BMI: body mass index; BP: blood pressure; AST: aspartate aminotransferase; ALT: alanine aminotransferase.
Variation in Blood Glucose During 2 Hours After Consumption of Each of the Four Fruits
Papaya consumption increased blood glucose level to a lesser degree than the consumption of the reference food which was glucose. Hyperglycemic peak was observed at T15 minutes for papaya, and at T45 minutes for glucose (Figure 1A). The trends in blood glucose level after consumption of mango and bread are indicated in Figure 1B. Mango consumption increased to a higher degree blood glucose level than the consumption of reference food (bread). The two curves had a shape which was superimposable with a glycemic peak at T30 minutes for mango.
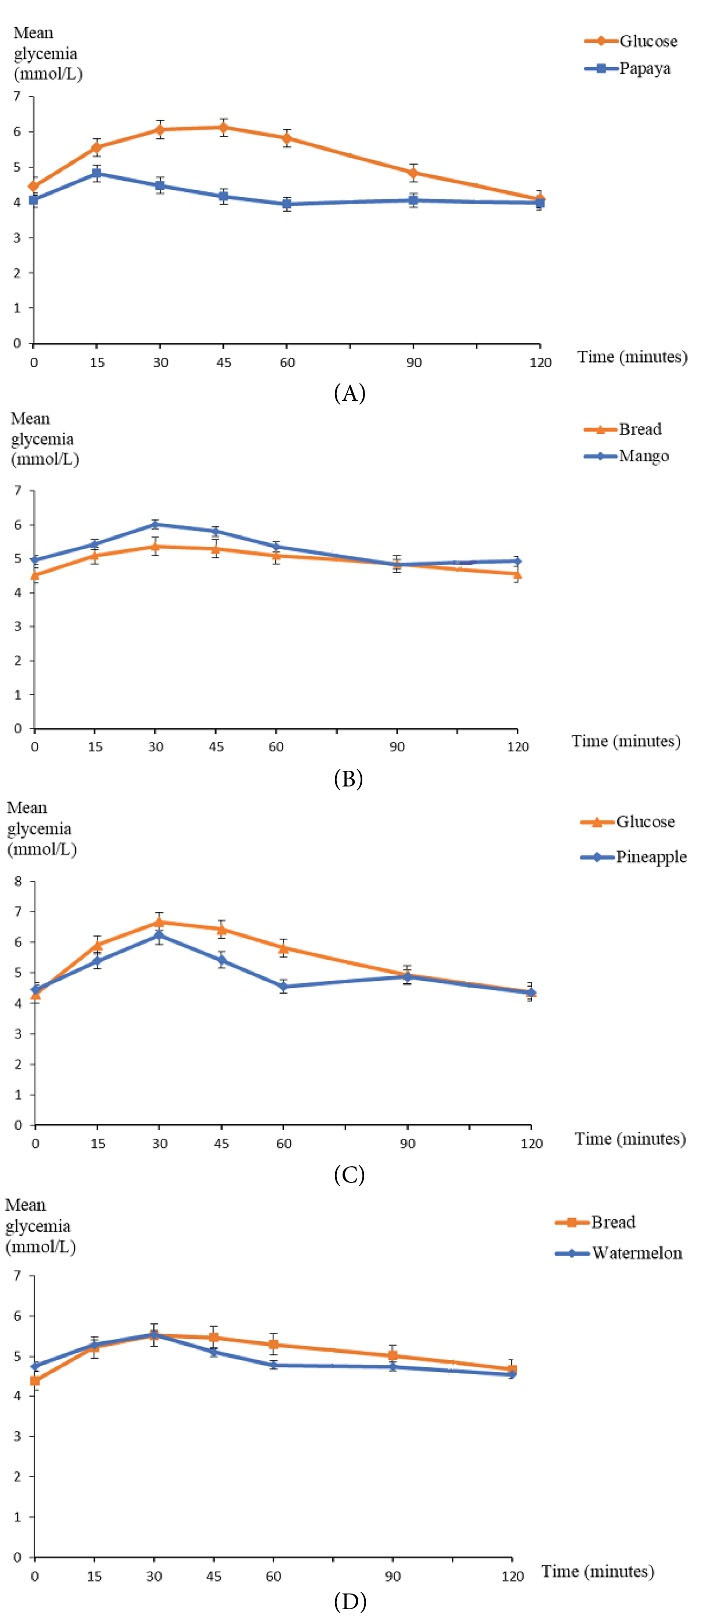
Figure 1.
Trends in Mean Blood Glucose Level Based on Time. (A)Group 1 (Papaya). (B) Group 2 (Mango). (C) Group 3 (Pineapple). (D) Group 4 (Watermelon).
.
Trends in Mean Blood Glucose Level Based on Time. (A)Group 1 (Papaya). (B) Group 2 (Mango). (C) Group 3 (Pineapple). (D) Group 4 (Watermelon).
Pineapple consumption increased blood glucose level to a lesser degree than the consumption of glucose as reference food; but both curves had a glycemic peak at T30 minutes and a return to almost identical valuesat T120 minutes. A downward trend in blood glucose level was observed at T60 minutes for pineapple (Figure 1C). Figure 1D illustrates the trends in blood glucose level based on time after the consumption of watermelon and bread. Watermelon consumption increased blood sugar level to a lesser degree than the consumption of the reference food (bread). Both curves had a superimposable shape till glycemic peak at T30 minutes; blood glucose lowering was more pronounced for watermelon consumption curve between T30 minutes and T120 minutes.
Fruits’ Glycemic Indexes and Loads
The AUC mean value in mmol.L
-1.min-1 of pineapple (89.21±21.75) was higher (P < 0.001) than the one of mango (34.71±13.62), papaya (23.46±15.06), and watermelon (20.30±16.47) (see Table 3). Mean GI varied considerably depending on the fruit. Mango’s GI was significantly higher (P = 0.007) than the one of papaya, watermelon and pineapple (Table 4). Watermelon (GI = 41.04%), papaya (GI = 46.77%), and pineapple (GI = 52.97%) had a low GI (<55%), whereas mango (GI = 117.09%) had a high GI (>75%).
Table 3.
Comparison of Incremental Areas Under the Curve (UAC) in mmol.L-1.min-1 of the 4 Tested Fruits
|
|
Mean Value±Standard deviation
|
Min-Max
|
Median Value
|
P
Value
|
|
Relevant fruit
|
|
|
|
<0.001
|
| Watermelon |
20.30±16.47 |
7.14-52.36 |
12.00 |
|
| Papaya |
23.46±15.06 |
3.97-53.25 |
22.28 |
|
| Mango |
34.71±13.62 |
14.25-56.25 |
30.70 |
|
| Pineapple |
89.21±21.75 |
62.75-124.50 |
90.75 |
|
Table 4.
Statistical Distribution Parameters of Fruits’ Glycemic Index
|
|
Mean Value±Standard deviation
|
Min-Max
|
Median Value
|
P
Value
|
|
Relevant fruit
|
|
|
|
0.007
|
| Watermelon |
41.04±34.06 |
13.56-96.96 |
18.97 |
|
| Papaya |
46.77±45.77 |
4.23-154.35 |
28.99 |
|
| Pineapple |
52.97±29.87 |
18.97-114.74 |
51.57 |
|
| Mango |
117.09±58.32 |
28.36-217.39 |
125.81 |
|
GL varied significantly depending on the fruits. Mango’s GL was significantly higher (P = 0.001) than the one of papaya, watermelon, and pineapple (Table 5). Watermelon (GL = 2.54), papaya (GL = 3.41), and pineapple (GL = 6.36) had a low GL (≤10), whereas mango (GL = 16.28) had a moderate GL (11 to 19).
Table 5.
Statistical Distribution Parameters of Fruits’ Glycemic Load
|
|
Mean Value±Standard deviation
|
Min-Max
|
Median Value
|
P
Value
|
|
Relevant fruit
|
|
|
|
0.001
|
| Watermelon |
2.54±2.11 |
0.84-6.01 |
1.18 |
|
| Papaya |
3.41±3.34 |
0.31-11.27 |
2.12 |
|
| Pineapple |
6.36±3.58 |
2.28-13.77 |
6.19 |
|
| Mango |
16.28±8.11 |
3.94-30.22 |
17.49 |
|
Discussion
After the consumption of each of the fruits, blood glucose level increased over time, reaching its peak at 30 minutes for mango, pineapple, and watermelon; whereas for papaya the peak came earlier at 15 minutes; and then blood glucose loweringwas observed over time. Furthermore, a downward trend in blood glucoselevelwas observed at T60 minutes regarding pineapple. Following the data from literature, the glycemic responses due to fruits’ consumption vary. A study conducted in Malaysia on the GI of durian fruit, papaya, pineapple, and watermelonhas shown an increase in blood glucose level over time, reaching its peak 30 minutes after the consumption of each of the four fruits, and then gradually declining till T120 minutes (22). On the contrary, a Nigerian study on ten healthy subjects has indicated that pineapple consumption causes a glycemic peak at T60 minutes, whereas papaya’s glycemic peak comes earlier in T45 minutes (23). Among subjects with type 2 diabetes, pineapple peaks in30 minutes, while banana, orange, mango and papaya peak in 60 minutes, after ingestion by measuring blood glucose levels every 30 minutesover a period of two hours (24). Another study focused on glycemic response of papaya, watermelon, and guava among healthy subjects revealed a peak in approximately 15 minutes, except for papaya which peaked at 30 minutes followed by gradual decrease in that glycemic response (25). The findings of our study, as well as those of other studies showed that with fixed amounts of carbohydrates available in the fruits, there were distinct variations in the glycemic response. This confirms the presumption that equal servings of carbohydrates in various foods may generate a different glycemic response from human subjects (26).
In this study, the AUC mean value of pineapple was higher than the one of mango, papaya, and watermelon. However, the GI of mango was higher than the one of pineapple, papaya, and watermelon. Mango had a high GI, whereas pineapple, papaya, and watermelon had low GIs. According to a study conducted in Malaysia (22), the AUC (mmol.L-1.min-1), after the consumption of pineapple (232±24), was significantly higher than the one after consumption of papaya (147±14), watermelon (139±8), and durian fruit (124±13) (P < 0.05). Also, pineapple GI (82±4) was significantly higher than the one of papaya (58±6), watermelon (55 ±3), and durian fruit (49±5) (P < 0.05). As a result, pineapple had a high GI and papaya had an intermediary GI, whereas watermelon and durian fruit were foods with a low GI. The AUC mean values in mmol.L-1.min-1 of pineapple (62.6±10.5) and papaya (63.9±14.1) were almost identical among healthy subjects in another study; however, papaya GI (86±26.8) was high, while the one of pineapple (64.5±11.3) was moderate (23). Among the subjects with diabetes, AUC mean values expressed in mmol.L-1.min-1 appeared as follows: pineapple (115.3±33.2), mango (101.6±28.7), and papaya (124.1±46.1); there was no significant difference between the GIs of those fruits; and the tested fruits had low GIs (24). AUCmean value (mmol.L-1.min-1) of watermelon (95±11) was higher than the one of papaya (80±7) without significant difference, while the GIs of both fruits were low: 50±6 for watermelon and 46±6 for papaya (25). Many reasons and hypotheses may account forthe differences between the glycemic responses and GIs of the fruits tested.
It has been demonstrated that dietary fibers, particularly soluble fibers, have a blood glucose lowering effect (27). Some mechanisms have been introduced to explain the blood glucose lowering effect of fibers (19):
- Gastric emptying: dietary fibers affect gastric emptying in many ways. First, they may slow down gastric filling, because of their swelling power, which in turn may slow down gastric emptying. Secondly, when some soluble fibers are mixed into liquid meals or into liquid/solid foods, they delay gastric fluidemptying by increasing the viscosity of gastric contents. Such an increase in the chyme viscosity may also slow down gastric emptying of meal solid components.
- Enzyme substrate interaction: fibers have few direct acute effects on the secretory function of exocrine pancreas; this suggests that the main effect of fibers on carbohydrates’ digestion is applied in the intestinal lumen. The inhibitory effects of dietary fibers on pancreatic enzymes’ activities were attributed to various factors, particularly pH changes, ion exchange properties, enzyme, and adsorption inhibitors. The presence of fibers in a form that limits starch gelatinization or hydrolytic enzymes’ access to starch may slow down the speed of starch digestion.
Acidity, which slows down gastric emptying, thus resulting in a slower digestion rate with subsequent reduction of glycemic response (19), may help explain the findings. Therefore, the organic acids contained in pineapple (28) have probably contributed to its low GI.
Many phytochemical compounds such as flavonoids and tannic acids found in watermelon may have a blood glucose lowering effect (29,30). The blood glucose lowering effect of flavonoids is related to flavones (a flavonoid sub-group) which are mostly present in watermelon and account for 95.53% of total polyphenols identified. The main mechanisms identified are: (i) adipocytokine regulation associated with increased serum adiponectin, thereby fostering cell insulin sensitivity; (ii) improved glucose uptake in adipocytes by using the peroxisome proliferator-activated gamma receptor (PPARƔ); (iii) GLUT4 translocation to 3T3-L1 adipocytes (31). In general, tannic acids may affect blood glucose level through various mechanisms, especially better glucose absorption in the blood peripheral tissue, as well as stimulation of secretion of pancreas β cells’ insulin and declined glycation of extracellular circulating proteins – glycated hemoglobin, in particular (32).
The differences in GI values of the same fruit obtained in different studies may be due to several factors relating to not only the fruits but also to the methodology used (25,33). These factors include: climate variations or change in the different geographic areas during cultivation, growth conditions, differences in sugar contents of fruits, ripening stage, fat content, harvest time, duration and method of storage, reference food used, as well as the time interval of blood sample collections for blood glucose levels’ measurement.
In the present study, papaya, pineapple, and watermelon had a low GL while mango had a moderate GL. Low GLs for watermelon, papaya, and pineapple have been reported to be 5, 4.6, and 8, respectively (25,26). In India, mango, pineapple, and watermelon have been found to have a low GL at 5.25, 1.9 and 2.2, respectively; whereas papaya has been revealed to have a moderate GL estimated at 12.8 (34). These varying results may be due to the fact that GL depends on the carbohydrates amount and GI of the food.
Conclusion
The results of this study revealed that watermelon, papaya, and pineapple were fruits with low GI, whereas mango had a higher GI. Furthermore, watermelon, papaya and pineapple had a low GL, while mango showed a moderate GL. Therefore, watermelon, papaya, and pineapple may be recommended for a safe consumption following dietary guidelines regarding the amount and variety of fruit. A more effective control of mango consumption is recommended, particularly for patients suffering from chronic diseases and those with poor glycemic control.
Authors’ Contribution
MG designed the study, supervised data collection and validated the manuscript. EL collected the experimental data and wrote the manuscript draft. TS reviewed the literature and wrote the manuscript draft. GD participated in the collection of experimental data. SZ also participated in the collection of experimental data.
Conflict of Interest Disclosures
The authors declare that they have no affiliations with or involvement in any organization or entity with any interest in the subject matter or materials discussed in this manuscript.
Ethical Issues
The research protocol of this study was approved by the Local Ethics Committee for Biomedical Research of the University of Parakou through Decision No. 0296/CLERB-UP/P/SP/R/SA.
Acknowledgments
The authors extend their gratitude to all the volunteers who accepted to participate inthis study.
References
- Standards of medical care in diabetes--2013. Diabetes Care 2013; 36(Suppl 1):S11-66. doi: 10.2337/dc13-S011 [Crossref] [ Google Scholar]
- Salehi M, Yousefinejad A, Pishdad G. The effect of a diet education with six iso-caloric meals on the body weight and blood glucose of diabetes type 2 patients. Food Sci Technol 2012; 32(2):329-33. doi: 10.1590/s0101-20612012005000035 [Crossref] [ Google Scholar]
- Salgado JM, Bombarde TA, Mansi DN, Piedade SM, Meletti LM. Effects of different concentrations of passion fruit peel (Passiflora edulis) on the glycemic control in diabetic rat. Food Sci Technol 2010; 30(3):784-9. doi: 10.1590/s0101-20612010000300034 [Crossref] [ Google Scholar]
- Jenkins DJ, Wolever TM, Taylor RH, Barker H, Fielden H, Baldwin JM. Glycemic index of foods: a physiological basis for carbohydrate exchange. Am J Clin Nutr 1981; 34(3):362-6. doi: 10.1093/ajcn/34.3.362 [Crossref] [ Google Scholar]
- Brouns F, Bjorck I, Frayn KN, Gibbs AL, Lang V, Slama G. Glycaemic index methodology. Nutr Res Rev 2005; 18(1):145-71. doi: 10.1079/nrr2005100 [Crossref] [ Google Scholar]
- Wolever TM, Mehling C. High-carbohydrate-low-glycaemic index dietary advice improves glucose disposition index in subjects with impaired glucose tolerance. Br J Nutr 2002; 87(5):477-87. doi: 10.1079/bjnbjn2002568 [Crossref] [ Google Scholar]
- Liu S, Willett WC, Stampfer MJ, Hu FB, Franz M, Sampson L. A prospective study of dietary glycemic load, carbohydrate intake, and risk of coronary heart disease in US women. Am J Clin Nutr 2000; 71(6):1455-61. doi: 10.1093/ajcn/71.6.1455 [Crossref] [ Google Scholar]
- Amano Y, Kawakubo K, Lee JS, Tang AC, Sugiyama M, Mori K. Correlation between dietary glycemic index and cardiovascular disease risk factors among Japanese women. Eur J Clin Nutr 2004; 58(11):1472-8. doi: 10.1038/sj.ejcn.1601992 [Crossref] [ Google Scholar]
- Hodge AM, English DR, O’Dea K, Giles GG. Glycemic index and dietary fiber and the risk of type 2 diabetes. Diabetes Care 2004; 27(11):2701-6. doi: 10.2337/diacare.27.11.2701 [Crossref] [ Google Scholar]
- Schulze MB, Liu S, Rimm EB, Manson JE, Willett WC, Hu FB. Glycemic index, glycemic load, and dietary fiber intake and incidence of type 2 diabetes in younger and middle-aged women. Am J Clin Nutr 2004; 80(2):348-56. doi: 10.1093/ajcn/80.2.348 [Crossref] [ Google Scholar]
- Järvi AE, Karlström BE, Granfeldt YE, Björck IE, Asp NG, Vessby BO. Improved glycemic control and lipid profile and normalized fibrinolytic activity on a low-glycemic index diet in type 2 diabetic patients. Diabetes Care 1999; 22(1):10-8. doi: 10.2337/diacare.22.1.10 [Crossref] [ Google Scholar]
- Giacco R, Parillo M, Rivellese AA, Lasorella G, Giacco A, D’Episcopo L. Long-term dietary treatment with increased amounts of fiber-rich low-glycemic index natural foods improves blood glucose control and reduces the number of hypoglycemic events in type 1 diabetic patients. Diabetes Care 2000; 23(10):1461-6. doi: 10.2337/diacare.23.10.1461 [Crossref] [ Google Scholar]
- Frost G, Keogh B, Smith D, Akinsanya K, Leeds A. The effect of low-glycemic carbohydrate on insulin and glucose response in vivo and in vitro in patients with coronary heart disease. Metabolism 1996; 45(6):669-72. doi: 10.1016/s0026-0495(96)90129-8 [Crossref] [ Google Scholar]
- Slabber M, Barnard HC, Kuyl JM, Dannhauser A, Schall R. Effects of a low-insulin-response, energy-restricted diet on weight loss and plasma insulin concentrations in hyperinsulinemic obese females. Am J Clin Nutr 1994; 60(1):48-53. doi: 10.1093/ajcn/60.1.48 [Crossref] [ Google Scholar]
- Luscombe ND, Noakes M, Clifton PM. Diets high and low in glycemic index versus high monounsaturated fat diets: effects on glucose and lipid metabolism in NIDDM. Eur J Clin Nutr 1999; 53(6):473-8. doi: 10.1038/sj.ejcn.1600779 [Crossref] [ Google Scholar]
- Augustin LS, Kendall CW, Jenkins DJ, Willett WC, Astrup A, Barclay AW. Glycemic index, glycemic load and glycemic response: an International Scientific Consensus Summit from the International Carbohydrate Quality Consortium (ICQC). Nutr Metab Cardiovasc Dis 2015; 25(9):795-815. doi: 10.1016/j.numecd.2015.05.005 [Crossref] [ Google Scholar]
- Jenkins DJ, Srichaikul K, Kendall CW, Sievenpiper JL, Abdulnour S, Mirrahimi A. The relation of low glycaemic index fruit consumption to glycaemic control and risk factors for coronary heart disease in type 2 diabetes. Diabetologia 2011; 54(2):271-9. doi: 10.1007/s00125-010-1927-1 [Crossref] [ Google Scholar]
- Balisteiro DM, Alezandro MR, Genovese MI. Characterization and effect of clarified araçá (Psidium guineenses Sw) juice on postprandial glycemia in healthy subjects. Food Sci Technol 2013; 33(Suppl 1):66-74. doi: 10.1590/s0101-20612013000500011 [Crossref] [ Google Scholar]
- Carbohydrates in human nutrition. Report of a joint FAO/WHO expert consultation. FAO Food Nutr Pap 1998; 66:1-140. [ Google Scholar]
- Stadlmayr B, Charrondiere UR, Enujiugha VN, Bayili RG, Fagbohoun EG, Samb B, et al. West African Food Composition Table. Rome: FAO; 2012.
- Lott JA, Turner K. Evaluation of Trinder’s glucose oxidase method for measuring glucose in serum and urine. Clin Chem 1975; 21(12):1754-60. doi: 10.1093/clinchem/21.12.1754 [Crossref] [ Google Scholar]
- Robert SD, Ismail AA, Winn T, Wolever TM. Glycemic index of common Malaysian fruits. Asia Pac J Clin Nutr 2008; 17(1):35-9. [ Google Scholar]
- Edo AE, Eregie A, Adediran OS, Ohwovoriole AE, Ebengho S. Postprandial glucose response to selected tropical fruits in normal glucose-tolerant Nigerians. Niger J Clin Pract 2011; 14(1):79-82. doi: 10.4103/1119-3077.79270 [Crossref] [ Google Scholar]
- Edo AE, Eregie A, Adediran OS, Ohwovoriole AE. Glycaemic response to some commonly eaten fruits in type 2 diabetes mellitus. West Afr J Med 2011; 30(2):94-8. [ Google Scholar]
- Francis RD, Bahado-Singh PS, Wheatley AO, Smith AM, Asemota HN. Glycemic index of selected foods in Jamaica. Pharmacovigilance and Pharmacoepidemiology 2019; 2(1):13-6. doi: 10.33805/2638-8235.110 [Crossref] [ Google Scholar]
- Francis RD, Bahado-Singh PS, Smith AM, Wheatley AO, Asemota HA. Glycemic index of traditional foods in Jamaica. Eur J Exp Biol 2018; 8(3):15. doi: 10.21767/2248-9215.100056 [Crossref] [ Google Scholar]
- Pi-Sunyer FX. Glycemic index and disease. Am J Clin Nutr 2002; 76(1):290S-8S. doi: 10.1093/ajcn/76/1.290S [Crossref] [ Google Scholar]
- Huet R. La composition chimique de l’ananas. Fruits 1958; 13(5):183-97. [ Google Scholar]
- Lamba SS, Buch KY, Lewis H III, Lamba J. Phytochemicals as potential hypoglycemic agents. Stud Nat Prod Chem 2000; 21(Pt B):457-96. doi: 10.1016/s1572-5995(00)80012-5 [Crossref] [ Google Scholar]
- Aba PE, Asuzu IU. Mechanisms of actions of some bioactive anti-diabetic principles from phytochemicals of medicinal plants: a review. Indian J Nat Prod Resour 2018; 9(2):85-96. [ Google Scholar]
- Jennings A, Welch AA, Spector T, Macgregor A, Cassidy A. Intakes of anthocyanins and flavones are associated with biomarkers of insulin resistance and inflammation in women. J Nutr 2014; 144(2):202-8. doi: 10.3945/jn.113.184358 [Crossref] [ Google Scholar]
- Masunda TA, Mbala MB, Kayembe SJ, Longoma BF, Ngbolua KN, Tshibangu DS, Mpiana PT. Activité anti-hyperglycémique et antiradicalaire des extraits des fruits de Raphia gentiliana De Wild (Arecaceae). Int J Biol Chem Sci 2014; 8(6):2441-51. doi: 10.4314/ijbcs.v8i6.7 [Crossref] [ Google Scholar]
- Sabeetha S, Barakatun Nisak MY, Amin I. Glycemic index of selected watermelon (Citrullus lanatus). Int Food Res J 2018; 25(6):2547-52. [ Google Scholar]
- Premanath M, Basavana Gowdappa H, Mahesh M, Suresh Babu M. A study of glycemic index of ten Indian fruits by an alternate approach. E-International Scientific Research Journal 2011; 3(1):11-8. [ Google Scholar]