Avicenna Journal of Medical Biochemistry. 9(2):83-87.
doi: 10.34172/ajmb.2021.14
Research Article
Serum Cystatin C in Chronic Kidney Disease: A Case-Control Study
Sukanya Shetty 1  , Janice D'Sa 2, * , Tirthal Rai 1, Srinidhi Rai 1 , Roopa Bhandary 1
Author information:
1Department of Biochemistry, KS Hegde Medical Academy, Nitte (deemed to be) University, Mangalore, Karnataka, India
2Department of Biochemistry, AJ Institute of Medical Sciences & Research Centre, Mangalore, Karnataka, India
Abstract
Background: Chronic kidney disease (CKD) is a major public health concern in recent years mainly due to its adverse clinical outcomes. It is most commonly attributed to diabetes mellitus (DM) and hypertension (HTN). Among the several novel biomarkers discovered to detect impaired renal function, serum cystatin C (SCysC) has gained importance.
Objectives: The aim of the study was to compare SCysC and serum creatinine (SCr) in CKD subjects and apparently healthy controls.
Methods: This case-control study comprising of 120 diagnosed cases of CKD and 40 controls was conducted at a tertiary care hospital. SCr and SCysC levels were estimated using modified Jaffe’s method and particle enhanced immunoturbidimetric method, respectively. Estimated glomerular filtration rate (eGFR) was calculated using CKD EPI formula. Comparison of SCr and SCysC between cases and controls was done using Mann Whitney U test. Pearson’s correlation test was used to study the correlation between variables. Statistical significance was considered at P<0.05.
Results: Both SCr and SCysC levels were higher in cases compared to controls (P<0.001). In the group comprising of Stage 1 and Stage 2 CKD subjects, all the subjects showed normal SCr levels, while 96.8% of the subjects showed elevated SCysC levels. SCysC (r=-0.800) showed better correlation than SCr (r=-0.724) with eGFR (P<0.001). A strong correlation was found between SCysC and SCr levels (r=-0.887, P<0.001).
Conclusion: SCysC is a good indicator of renal dysfunction and may be used to screen patients with long duration of DM or HTN for CKD.
Keywords: Renal insufficiency, Chronic, Cystatin C, Creatinine, Biomarkers
Copyright and License Information
© 2021 The Author(s); Published by Hamadan University of Medical Sciences.
This is an open-access article distributed under the terms of the Creative Commons Attribution License (
http://creativecommons.org/licenses/by/4.0), which permits unrestricted use, distribution, and reproduction in any medium provided the original work is properly cited.
Background
Chronic kidney disease (CKD) is one of the major public health concerns in recent years due to its adverse clinical outcomes which include cardiovascular disease (CVD), end-stage renal disease (ESRD), and mortality (1,2). CKD is most commonly attributed to diabetes mellitus (DM) and hypertension (HTN) (1).
Most patients with CKD are asymptomatic. They are identified during routine blood or urine tests, less frequently as an incidental finding (1).Clinical features of the disease become apparent only during later stages of CKD during which the patients may require hemodialysis or renal replacement therapy (3). Early detection of CKD is hence essential to prevent disease progression and initiate treatment protocols.
CKD is defined as the presence of abnormalities in the structure or function of the kidneys persisting for more than 3 months. Once diagnosed, it is important to determine the stage of CKD based on the GFR and urine albumin creatinine ratio (ACR) to predict the prognosis 1,4).
At present, most of the clinicians and clinical laboratories report eGFR based on SCr levels using GFR estimating equations such as Chronic Kidney Disease Epidemiology Collaboration (CKD EPI) and Modification of Diet in Renal Disease (MDRD) equations. This has eliminated the need for performing direct measurement of GFR which is considered expensive and laborious (1).
Estimation of GFR based on SCr alone is not ideal. SCr level is influenced by various factors such as muscle mass, variations in filtration based on age, renal tubular secretion, drug intake, analytical factors, and extrarenal clearance (5). In order to overcome these limitations, extensive research has been carried out over years to find an alternate biomarker.
Among the several novel biomarkers discovered for the detection of impaired renal function, serum cystatin C (SCysC) has gained more importance. Human cystatin C (CysC) is a low molecular weight cysteine protease inhibitor produced by all nucleated cells. It is filtered freely in the glomerulus, gets reabsorbed in the proximal tubules and does not get excreted in the renal tubules as it is completely degraded(6). SCysC is considered to be better than SCr in the estimation of renal function as it is not influenced by age, gender, nutritional status, and body size(7). Unlike SCr, SCysC is more useful in diagnosing a mild decrease in GFR, i.e., 60-80 mL/min/1.732 m2(8). Therefore, SCysC has been proposed to be a promising marker that can be utilized for the early diagnosis of nephropathy.
This study was undertaken to compare the levels of SCysC and SCr in CKD patients and apparently healthy controls.
Materials and Methods
This study was carried out at a tertiary care hospital. Subjects aged between 35-70 years, including both genders, diagnosed with CKD by the Nephrologist as per the Kidney Disease Outcomes Quality Initiative (KDOQI) guidelines (9)were selected as cases. Subjects with a history of liver disease, thyroid dysfunction, malignancy, and muscular dystrophies as well as pregnant women were excluded from the study. Age and gender-matched apparently healthy volunteers were selected as controls.
Elicitation of the relevant history, clinical examination, and anthropometric measurements were carried out in all subjects. Fasting venous blood specimens were collected from the subjects in plain vacutainers from the antecubital vein. The sera were obtained by subjecting the venous blood samples to centrifugation at 3000 rpm for 10 minutes. Aliquots of sera were stored at -20°C until assayed. SCysC and SCr were estimated using the particle-enhanced immunoturbidimetric method and modified Jaffe’s method, respectively. Biochemical analyses were done using Roche cobas c311 automated analyzer. In this study, 0.7-1.4 mg/dL and 0.47-1.09 mg/L were regarded as normal reference levels for SCr and SCysC, respectively, according to the reagent kit instructions. The eGFR was calculated using CKD EPI 2009 equation (10) based on SCr levels as follows:
eGFR = 141 x min (SCr/κ, 1)α x max (SCr /κ, 1)-1.209 x 0.993Age x 1.018 [if female] x 1.159 [if Black]
Where, eGFR = mL/min/1.73 m2, SCr (serum creatinine) = mg/dL, κ = 0.7 (females) or 0.9 (males), α = -0.329 (females) or -0.411 (males), min = minimum of SCr/κ or 1, max = maximum of SCr/κ or 1, age is in years
Statistical analysis was done using SPSS version 20.0. The normality of the data was tested using Kolmogorov Smirnov test. Qualitative data were represented as frequency and percentage. As SCysC, SCr, and eGFR followed skewed distribution, the values were represented as median and interquartile range. Comparison between descriptive data was done using Mann-Whitney U test. Pearson’s correlation test was used to study the correlation between the variables. Statistical significance was considered at P < 0.05.
Results
The total number of participants in the study was 160 subjects including 120 cases and 40 controls. The results of the biochemical analysis of the study subjects are depicted in Table 1. Of the 120 CKD cases, 26.7% (n = 32) underwent dialysis.
Table 1.
Comparison of Biochemical Parameters and eGFR Between Cases and Controls
|
Parameters
|
CKD Cases (n=120)
|
Controls (n=40)
|
| Serum creatinine (in mg/dL) |
2.26** (1.21–4.10) |
0.80 (0.71–0.96) |
| Serum cystatin C (mg/L) |
2.34** (1.65–3.45) |
0.96 (0.83–1.04) |
| Estimated GFR (mL/min/1.732 m2) |
28.50** (14.50–61.50) |
94.50 (84.25–109.75) |
| Serum creatinine-eGFR ratio |
0.0845** (0.0209-0.2849) |
0.0085 (0.0067-0.0086) |
| Serum cystatin C-eGFR ratio |
0.0872** (0.0306–0.2110) |
0.0098 (0.0086–0.0118) |
The CKD cases were further classified into stages based on eGFR as per the KDOQI guidelines (9). As the number of CKD cases belonging to Stages 1 and 2 was less, the two stages were grouped together. The biochemical parameters were compared as shown in Table 2.
Table 2.
Comparison of Bioche mical Parameters and eGFR Between Patients With Different Stages of CKD and Controls
|
Parameters
|
Controls
(n=40)
|
Stages 1 and 2
(n=31)
|
Stage 3
(n=29)
|
Stage 4
(n=30)
|
Stage 5
(n=30)
|
| Serum creatinine (mg/dL) |
0.80
(0.71–0.96)
|
1.00**
(0.89-1.12)
|
1.71**
(1.44-2.06)
|
2.92**
(2.48-3.55)
|
7.25**
(5.77-1.08)
|
| Serum cystatin C (mg/L) |
0.96
(0.83–1.04)
|
1.35**
(1.18-1.64)
|
1.93**
(1.72-2.39)
|
2.69**
(2.31-3.14)
|
4.69**
(3.59-5.49)
|
|
Estimated GFR (mL/min/1.732 m2)
|
94.50
(84.25–109.75)
|
79.00**
(69.00-87.00)
|
42.00**
(35.50-48.50)
|
21.50**
(18.00-25.25)
|
7.50**
(5.00-9.25)
|
| Serum creatinine-eGFR ratio |
0.0085
(0.0067-0.0086)
|
0.0125**
(0.0100-0.0166)
|
0.0364**
(0.0278-0.0585)
|
0.1407**
(0.0983-0.1961)
|
0.8775**
(0.6249–2.2470)
|
| Serum cystatin C-eGFR ratio |
0.0098
(0.0086–0.0118)
|
0.0184**
(0.0137-0.0220)
|
0.0465**
(0.0388–0.0548)
|
0.1325**
(0.0995–0.1667)
|
0.6200**
(0.4185–1.1079)
|
Comparison with the previous stage; ** P < 0.001.
Further evaluations were performed on CKD cases to study the distribution of elevated biochemical parameters (Figure 1). In this study, 1.4 mg/dL and 1.09 mg/L were regarded as upper limits of reference intervals for SCr and SCysC, respectively, based on the reagent kit instructions. It is interesting to note that in the group comprising of subjects with Stages 1 and 2 CKD (eGFR ≥ 60 mL/min/1.732 m2), the SCr levels were within the normal reference range in all, while SCysC was elevated in 96.8% (n = 30) of them. Among stage 3 patients (eGFR 30-59 mL/min/1.732 m2), SCr and SCysC levels were elevated in 79.3% (n = 23) and 100% (n = 29) of the cases, respectively. Among stages 4 and 5 patients (eGFR < 30 mL/min/1.732 m2), both SCr and SCysC levels were elevated in all cases.
Both SCr (r = -0.724, P < 0.001) and serum CysC (r = -0.800, P < 0.001) showed a negative correlation with eGFR (Figures 2 and 3). Serum CysC correlated positively with SCr (r = 0.887, P < 0.001), which was statistically significant (Figure 4).
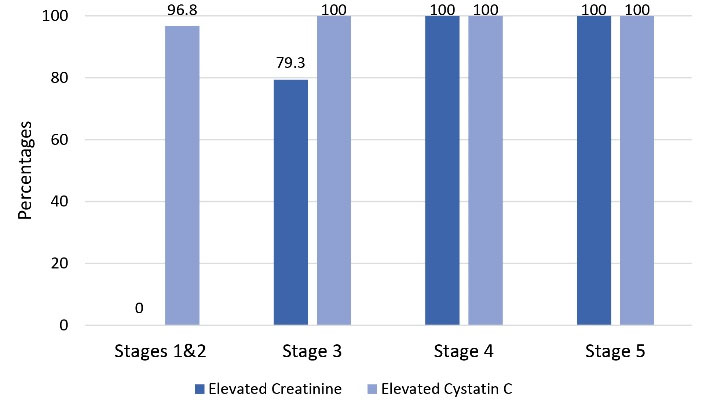
Figure 1.
Distribution of Elevated Biochemical Parameters Among CKD Cases.
.
Distribution of Elevated Biochemical Parameters Among CKD Cases.
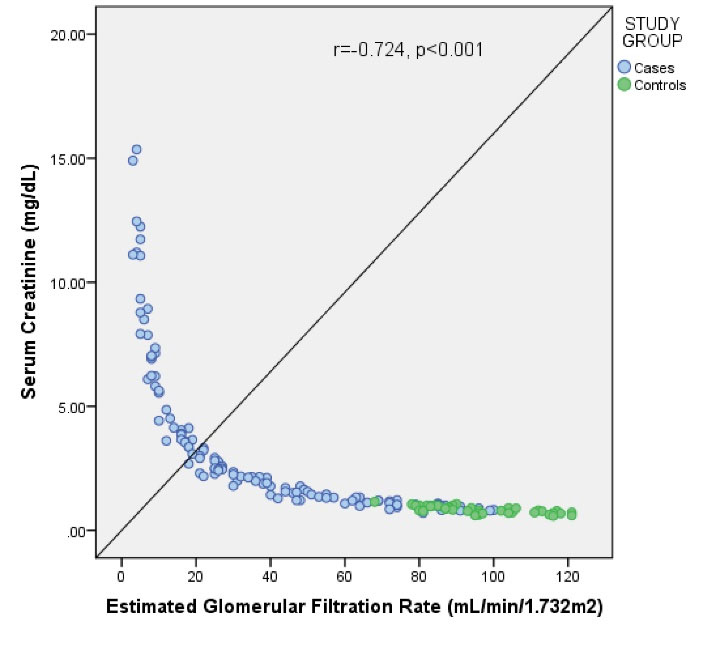
Figure 2.
Correlation of Serum Creatinine With eGFR Among the Study Subjects.
.
Correlation of Serum Creatinine With eGFR Among the Study Subjects.
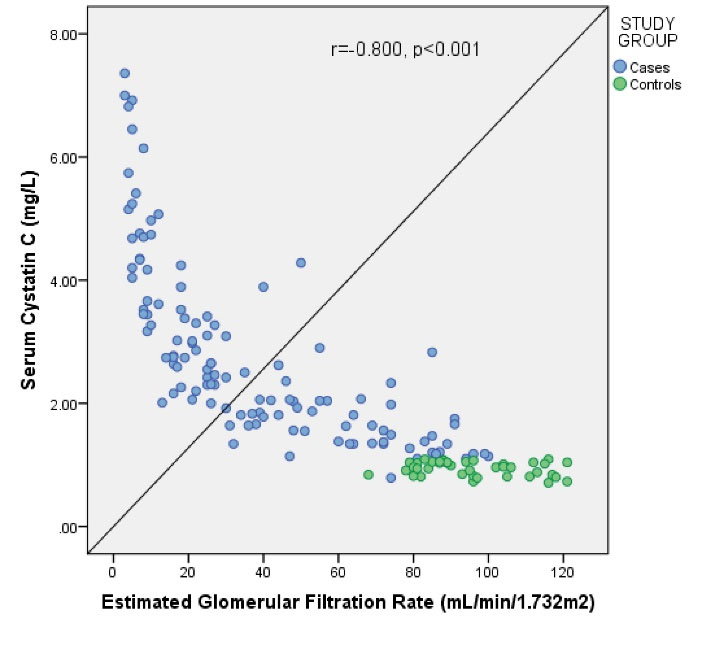
Figure 3.
Correlation of Serum Cystatin C With eGFR Among the Study Subjects.a
.
Correlation of Serum Cystatin C With eGFR Among the Study Subjects.a
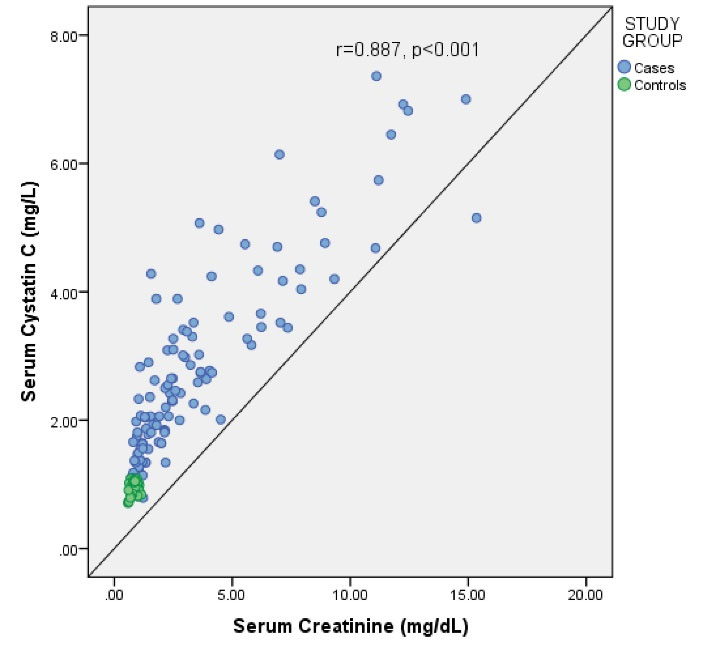
Figure 4.
Correlation of Serum Cystatin C With Serum Creatinine Among the Study Subjects.
.
Correlation of Serum Cystatin C With Serum Creatinine Among the Study Subjects.
Discussion
CysC is a low molecular weight protein belonging to the human cystatin family, comprising of twelve proteins (11,12). CysC was first suggested as an endogenous marker of GFR in 1985 by Simonsen et al (13).
CysC is present in almost all body fluids and tissues which include the brain, liver, kidney, placenta, and seminal vesicles (14). CysC is cleared from the circulation through the kidneys. Due to its low molecular weight as well as high isoelectric point, it is freely filtered by the glomerulus, reabsorbed, and subsequently catabolized in the proximal renal tubules (15,16). Its half-life is about 1.5 hours (17).
The current study was carried out to demonstrate the usefulness of estimating serum CysC in CKD patients.
The present study showed that SCysC and SCr levels were significantly higher in CKD subjects compared to controls (P < 0.001). These findings were similar to those of the previous studies done by Bhoi et al (18) and Dhupper et al (19), demonstrating high levels of SCysC and SCr in progressive chronic renal disease compared to controls.
The levels of SCysC and SCr were compared between controls and patients with various stages of CKD. There was a significant increase in both parameters across the groups comprising of controls and CKD stages. Dhupper et al also reported a stagewise increase in both SCysC and SCr between controls and patients with stages 3-5 CKD (19). It is interesting to note that in the group comprised of Stage 1 and Stage 2 CKD patients, a reduction in the number of functional nephrons was observed which resulted in a decrease in GFR that is considered the hallmark of CKD. Creatinine clearance is a reflection of the glomerular filtration rate (20). A decrease in SCr level with a declining GFR has been well documented in CKD patients. CysC, having characteristics of an ideal filtration marker, follows a similar trend to GFR (21). Hence, SCysC decreases with a reduction in GFR.
Correlation studies revealed that eGFR correlated better with SCysC (r = -0.800, P < 0.001) compared to SCr (r = -0.724, P < 0.001). Similar findings were seen in a previous study where SCysC was found to have a better correlation with eGFR (r = -0.877, P < 0.001), calculated using MDRD formula, than SCr (r = -0.777, P < 0.001) (19).
There was also a strong positive correlation between the SCr and SCysC levels which was statistically significant in this study (r = 0.887, P < 0.001), similar to findings of studies conducted by Tsai et al (22) and Dhupper et al (19).
The limitations of SCr as a marker of renal function are well known. There is a need to establish an alternative marker since renal assessment based on SCr alone is not adequate.
CysC was proposed as an alternative biomarker for GFR estimation several years ago. SCysC has been documented to be more reliable than SCr. Despite this, SCysC is still not implemented as a routine test in clinical practice (23).
In 2018, a survey was conducted on 369 participants comprising of leading nephrologists and intensivists. About 25% of the study participants believed that SCr, as a routine laboratory test, should be replaced with a new biomarker and only 15% used CysC in their clinical practice (24).
The incorporation of CysC in GFR estimating equations has proved to be beneficial especially in children, older adults, and persons with acute illness since SCr estimation can be highly unpredictable with extremes of age and illness (23). In general, SCysC based eGFR equations have better accuracy than SCr-based equations (7).
CysC is also reported to have an independent association with CVD, ESRD, and mortality (7). The use of CKD-EPI cystatin C equation to calculate eGFR improves the risk classification for associated morbidities and mortalities among CKD patients (25).
Conclusion
The current study established that SCysC is increased considerably in CKD patients. Stagewise increase in SCysC was observed which was comparable with SCr. Estimation of SCysC especially in CKD patients with mild to moderate reduction in GFR is useful since SCr may appear normal. The limitations of the study were the small sample size and the inability to quantify albuminuria due to certain constraints.
Acknowledgements
Nil.
Authors’ Contributions
SS conceived, designed, and supervised the study. JD collected the data, performed data analysis, and wrote the manuscript. TR compiled the references, proofread, and edited the manuscript. SR proofread and edited the manuscript. RRB proofread and edited the manuscript. All authors read and approved the manuscript.
Conflict of Interest Disclosures
The authors declare that they have no conflict of interest.
Ethical Issues
This study was approved by Institutional Ethical Committee, K.S Hegde Medical Academy, Nitte (deemed to be) University, Mangalore, Karnataka, India (INST.EC/EC/073/2014-15). Informed consent was obtained from all participants included in the study.
References
- Chen TK, Knicely DH, Grams ME. Chronic kidney disease diagnosis and management: a review. JAMA 2019; 322(13):1294-304. doi: 10.1001/jama.2019.14745 [Crossref] [ Google Scholar]
- Romagnani P, Remuzzi G, Glassock R, Levin A, Jager KJ, Tonelli M. Chronic kidney disease. Nat Rev Dis Primers 2017; 3:17088. doi: 10.1038/nrdp.2017.88 [Crossref] [ Google Scholar]
- Kinchen KS, Sadler J, Fink N, Brookmeyer R, Klag MJ, Levey AS. The timing of specialist evaluation in chronic kidney disease and mortality. Ann Intern Med 2002; 137(6):479-86. doi: 10.7326/0003-4819-137-6-200209170-00007 [Crossref] [ Google Scholar]
- Andrassy KM. Comments on ‘KDIGO 2012 clinical practice guideline for the evaluation and management of chronic kidney disease’. Kidney Int 2013; 84(3):622-3. doi: 10.1038/ki.2013.243 [Crossref] [ Google Scholar]
- Delanaye P, Cavalier E, Pottel H. Serum creatinine: not so simple!. Nephron 2017; 136(4):302-8. doi: 10.1159/000469669 [Crossref] [ Google Scholar]
- Chew JS, Saleem M, Florkowski CM, George PM. Cystatin C--a paradigm of evidence based laboratory medicine. Clin Biochem Rev 2008; 29(2):47-62. [ Google Scholar]
- Benoit SW, Ciccia EA, Devarajan P. Cystatin C as a biomarker of chronic kidney disease: latest developments. Expert Rev Mol Diagn 2020; 20(10):1019-26. doi: 10.1080/14737159.2020.1768849 [Crossref] [ Google Scholar]
- Shemesh O, Golbetz H, Kriss JP, Myers BD. Limitations of creatinine as a filtration marker in glomerulopathic patients. Kidney Int 1985; 28(5):830-8. doi: 10.1038/ki.1985.205 [Crossref] [ Google Scholar]
- National Kidney Foundation. K/DOQI clinical practice guidelines for chronic kidney disease: evaluation, classification, and stratification. Am J Kidney Dis 2002; 39(2 Suppl 1):S1-266. [ Google Scholar]
- Levey AS, Stevens LA. Estimating GFR using the CKD epidemiology collaboration (CKD-EPI) creatinine equation: more accurate GFR estimates, lower CKD prevalence estimates, and better risk predictions. Am J Kidney Dis 2010; 55(4):622-7. doi: 10.1053/j.ajkd.2010.02.337 [Crossref] [ Google Scholar]
- Brzin J, Popovic T, Turk V, Borchart U, Machleidt W. Human cystatin, a new protein inhibitor of cysteine proteinases. Biochem Biophys Res Commun 1984; 118(1):103-9. doi: 10.1016/0006-291x(84)91073-8 [Crossref] [ Google Scholar]
- Grubb A, Löfberg H. Human gamma-trace, a basic microprotein: amino acid sequence and presence in the adenohypophysis. Proc Natl Acad Sci U S A 1982; 79(9):3024-7. doi: 10.1073/pnas.79.9.3024 [Crossref] [ Google Scholar]
- Simonsen O, Grubb A, Thysell H. The blood serum concentration of cystatin C (gamma-trace) as a measure of the glomerular filtration rate. Scand J Clin Lab Invest 1985; 45(2):97-101. doi: 10.3109/00365518509160980 [Crossref] [ Google Scholar]
- Filler G, Bökenkamp A, Hofmann W, Le Bricon T, Martínez-Brú C, Grubb A. Cystatin C as a marker of GFR--history, indications, and future research. Clin Biochem 2005; 38(1):1-8. doi: 10.1016/j.clinbiochem.2004.09.025 [Crossref] [ Google Scholar]
- Jacobsson B, Lignelid H, Bergerheim US. Transthyretin and cystatin C are catabolized in proximal tubular epithelial cells and the proteins are not useful as markers for renal cell carcinomas. Histopathology 1995; 26(6):559-64. doi: 10.1111/j.1365-2559.1995.tb00275.x [Crossref] [ Google Scholar]
- Tenstad O, Roald AB, Grubb A, Aukland K. Renal handling of radiolabelled human cystatin C in the rat. Scand J Clin Lab Invest 1996; 56(5):409-14. doi: 10.3109/00365519609088795 [Crossref] [ Google Scholar]
- Knight EL, Verhave JC, Spiegelman D, Hillege HL, de Zeeuw D, Curhan GC. Factors influencing serum cystatin C levels other than renal function and the impact on renal function measurement. Kidney Int 2004; 65(4):1416-21. doi: 10.1111/j.1523-1755.2004.00517.x [Crossref] [ Google Scholar]
- Bhoi Bharat K, Maheshwari Amitkumar V, Sadariya Bhavesh R, Shaikh Sahema M, Panchal Mittal A. Comparison of estimated glomerular filtration rate using different analytes in chronic kidney disease patients. Int J Res Med 2015; 4(3):8-13. [ Google Scholar]
- Dhupper V, Ghalaut VS, Kulshrestha MR, Bhadra J, Yadav U, Mahor DS. Evaluation of cystatin C as a marker of estimated glomerular filtration rate (eGFR) in different stages of chronic kidney disease (CKD). Sch Acad J Biosci 2015; 3(4):328-34. [ Google Scholar]
- Lubowitz H, Slatopolsky E, Shankel S, Rieselbach RE, Bricker NS. Glomerular filtration rate Determination in patients with chronic renal disease. JAMA 1967; 199(4):252-6. doi: 10.1001/jama.199.4.252 [Crossref] [ Google Scholar]
- Rule AD, Bergstralh EJ, Slezak JM, Bergert J, Larson TS. Glomerular filtration rate estimated by cystatin C among different clinical presentations. Kidney Int 2006; 69(2):399-405. doi: 10.1038/sj.ki.5000073 [Crossref] [ Google Scholar]
- Tsai JP, Wu SW, Hung TW, Kao WT, Hong CL, Lian JD. Diagnostic performance of serum cystatin C and serum creatinine in the prediction of chronic kidney disease in renal transplant recipients. Transplant Proc 2010; 42(10):4530-3. doi: 10.1016/j.transproceed.2010.09.150 [Crossref] [ Google Scholar]
- Ebert N, Shlipak MG. Cystatin C is ready for clinical use. Curr Opin Nephrol Hypertens 2020; 29(6):591-8. doi: 10.1097/mnh.0000000000000638 [Crossref] [ Google Scholar]
- Digvijay K, Neri M, Fan W, Ricci Z, Ronco C. International survey on the management of acute kidney injury and continuous renal replacement therapies: year 2018. Blood Purif 2019; 47(1-3):113-9. doi: 10.1159/000493724 [Crossref] [ Google Scholar]
- Shlipak MG, Matsushita K, Ärnlöv J, Inker LA, Katz R, Polkinghorne KR. Cystatin C versus creatinine in determining risk based on kidney function. N Engl J Med 2013; 369(10):932-43. doi: 10.1056/NEJMoa1214234 [Crossref] [ Google Scholar]