Avicenna Journal of Medical Biochemistry. 12(1):10-18.
doi: 10.34172/ajmb.2525
Original Article
Cardio- and Hepatoprotective Effects of Hydrogen Sulfide in a High-Fat Diet and Low-Dose Streptozotocin-Induced Type 2 Diabetic Rats
Hadis Abutalebian 1  , Mohammad Esmaeil Shahaboddin 1 , Maryam Akhavan Taheri 2 , Azam Ghaseminezhad 1, Gholamreza Ghavipanjeh 3 , Mojtaba Sehhat 4 , Nejat Kheiripour 1, *
Author information:
1Biochemistry and Nutrition Research Center in Metabolic Diseases, Kashan University of Medical Sciences, Kashan, Iran
2Germ Cell Production Research Center, Kashan University of Medical Sciences, Kashan, Iran
3Physiology Research Center, Kashan University of Medical Sciences, Kashan, Iran
4Trauma Research Center, Kashan University of Medical Sciences, Kashan, Iran
Abstract
Background: Hydrogen sulfide (H2S) is the third most crucial gas that is produced inside the body, and at physiological levels, it increases a wide range of health properties, such as anti-inflammatory antioxidant effects.
Objectives: This study aimed at evaluating the impact of H2S administration on oxidative stress (OS) in the heart and liver tissues of diabetic rats.
Methods: Twenty-eight Wistar rats were randomly divided into 4 groups, namely, the healthy control group, the diabetic group, and diabetic groups treated with 50 µM/kg and 100 µM/kg of H2S. After 60 days of treatment, the animals were sacrificed, and biochemical and OS markers were determined using colorimeter methods. In addition, the liver tissue underwent histological assessment.
Results: The findings revealed that H2S controlled the weight of rats and significantly decreased fasting blood sugar (FBS) in the treatment group with a dose of 50 µM/kg and 100 µM/kg (P<0.05) compared to the diabetic animals. Further, insulin concentration and insulin resistance in the H2S 100 µM/kg group decreased in comparison to the diabetic group (P<0.05). The levels of triglyceride, cholesterol, atherogenic index, and low-density lipoprotein in H2S-treated animals were markedly lower than in the diabetic group (P<0.05). The results of OS parameters demonstrated that H2S 100 µM/kg reduced the malondialdehyde in the heart tissue compared to the diabetic group (P<0.05). The histological assessment also confirmed the effectiveness of H2S in improving liver morphology and parenchymal structure.
Conclusion: According to the results of this study, H2S can be considered a suitable therapeutic agent to prevent diabetes complications.
Keywords: Diabetes mellitus, Hydrogen sulfide, Oxidative stress, Heart, Liver,
Copyright and License Information
© 2024 The Author(s); Published by Hamadan University of Medical Sciences.
This is an open-access article distributed under the terms of the Creative Commons Attribution License (
https://creativecommons.org/licenses/by/4.0), which permits unrestricted use, distribution, and reproduction in any medium provided the original work is properly cited.
Please cite this article as follows: Abutalebian H, Shahaboddin ME, Akhavan Taheri M, Ghaseminezhad A, Ghavipanjeh G, Sehhat M, et al. Cardio- and Hepatoprotective effects of Hydrogen Sulfide in a high-fat diet and low-dose streptozotocin-induced type 2 diabetic rats. Avicenna J Med Biochem. 2024; 12(1):10-18. doi:10.34172/ajmb.2525
Background
Currently, diabetes mellitus (DM) is one of the main chronic endocrine disorders in the world and occurs due to the production of insulin, or insulin resistance (1). DM can be considered one of the main causes of the incidence of heart and liver diseases (2). Hyperglycemia conditions induce oxidative stress (OS) through various mechanisms, such as the increased rate of reactive oxygen species production or the reduction of the antioxidant defense mechanism. The increased production of reactive oxygen species is associated with the pathogenesis and complications of DM (3).
Hydrogen sulfide (H2S) is known as the third most crucial gas that is produced inside the body. H2S is physiologically produced from cysteine and homocysteine (4,5). Numerous studies have revealed the role of endogenous H2S in the pathogenesis and progression of type 2 DM (T2DM). H2S has anti-inflammatory, anti-apoptotic, and antioxidant effects. In addition, available evidence indicates the role of H2S in preventing diabetes complications such as nephropathy, cardiomyopathy, and hepatic disorders. Therefore, this endogenous gas shows a promising strategy for the management and prevention of diabetes and its complications (6). Although several studies have confirmed the protective effects of H2S gas on diabetes and its related disorders, its mechanism has not been fully elucidated yet. Accordingly, this study sought to investigate the effects of H2S administration on biochemical and OS parameters in heart and liver tissues in T2DM animals induced by a high-fat diet (HFD) and single low-dose streptozotocin (STZ).
Materials and Methods
Twenty-eight male Wistar rats (200 ± 20 g) were used in this experimental study. The rats were maintained in standard conditions for one week (12/12 light/dark cycles). Then, they were randomly and equally divided into four groups (each containing 7 animals), including the control group, T2DM group, and T2DM groups treated with an intraperitoneal injection of 50 µM/kg and 100 µM/kg of H2S. For the induction of T2DM, the rats received an HFD (35% fat, 24% protein, and 26% carbohydrate) for 60 days, and on the 61st day, while they were fasting for 12 hours, they received a single dose of STZ 40 mg/kg intraperitoneally. To confirm diabetes, 3 days later, fasting blood sugar (FBS) was determined by a glucometer. Rats with an FBS above 150 were considered diabetic (7). In the treatment groups, H2S with doses of 50 µM/kg and 100 µM/kg was intraperitoneally administered for 60 days. To prepare H2S in the selected daily doses, a certain amount of sodium hydrosulfide (NaHS) powder was taken based on its molecular weight (56.06 mol/g), dissolved in normal saline, and then injected into the diabetic-treated groups (8). The experimental timeline is shown in Figure 1. At the end of the study, the animals were anesthetized with a combination of low doses of ketamine and xylazine after an overnight fast, and the serum samples were collected and stored at −20 °C for biochemical tests. The activities of creatine kinase-MB (CK-MB), lactate dehydrogenase (LDH), troponin I, aspartate aminotransferase (AST), alkaline phosphatase (ALP), and alanine transaminase (ALT) underwent measurement (9). In addition, heart and liver tissues were separated and stored for antioxidant and histological examinations.
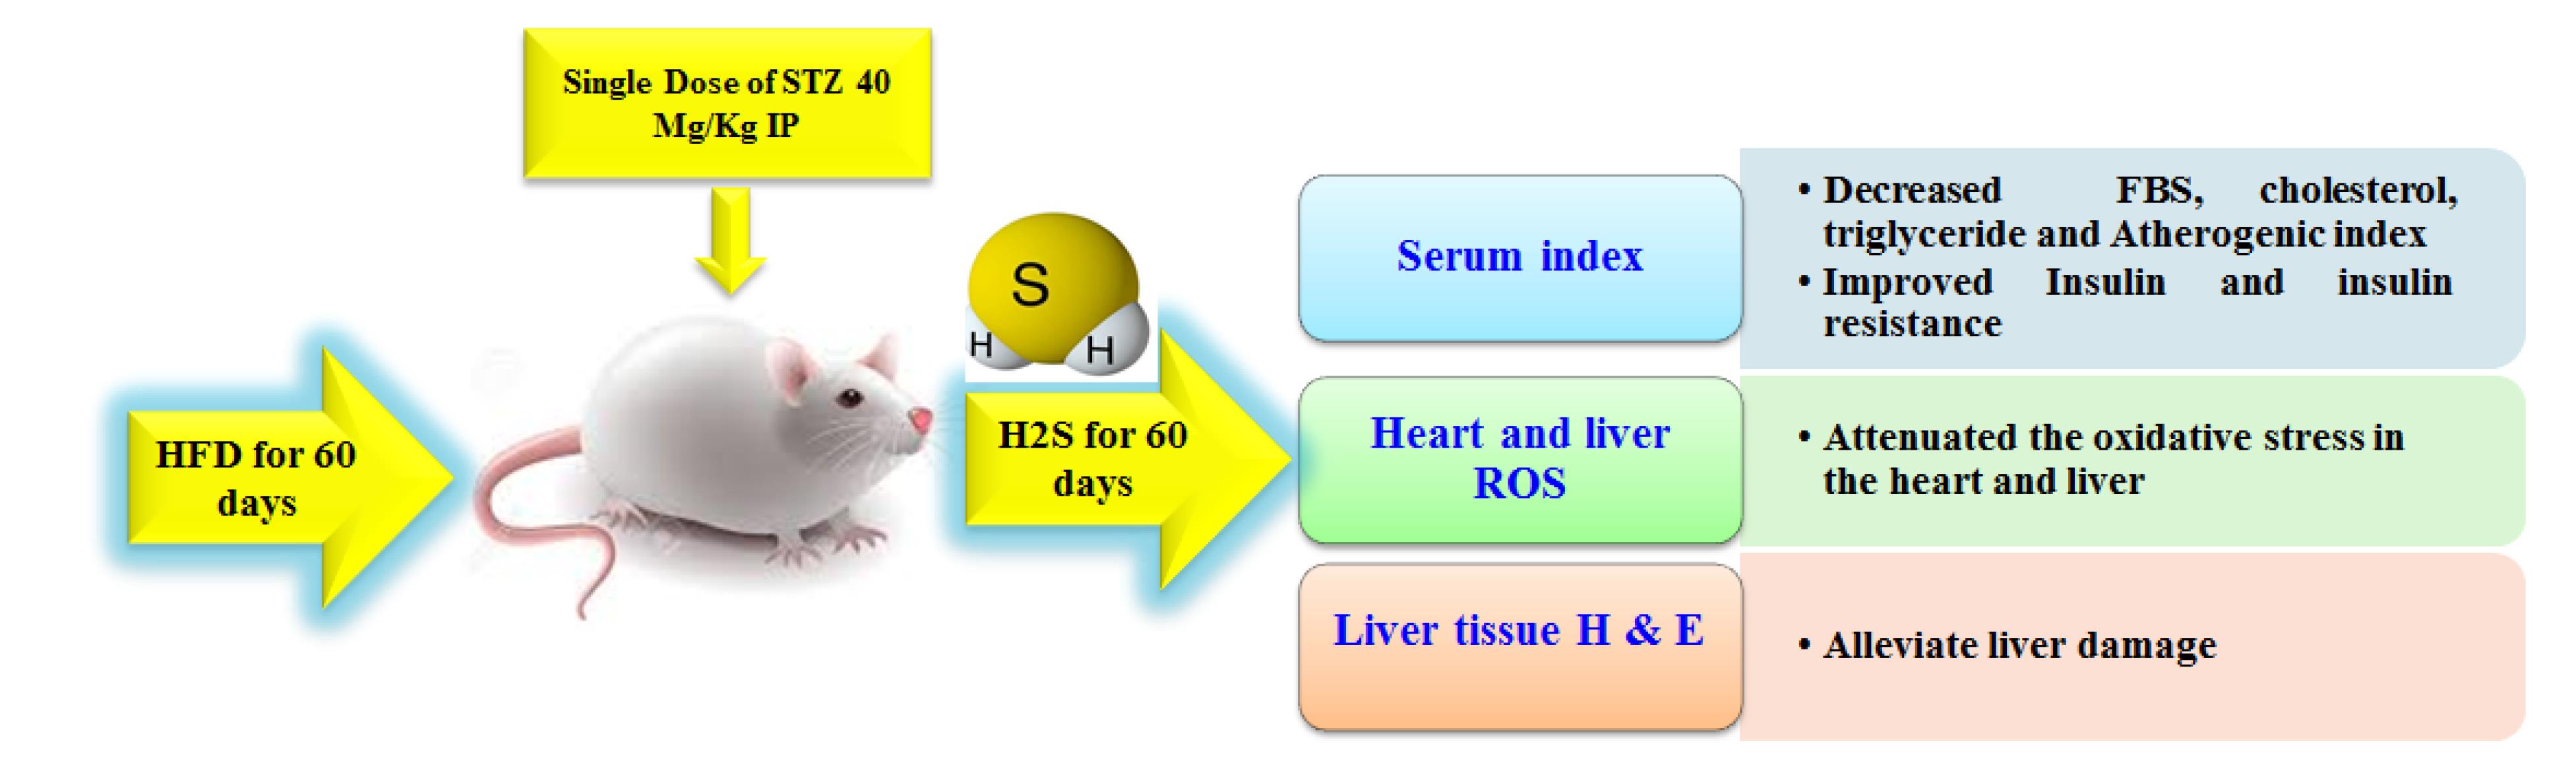
Figure 1.
Experimental Time Line:Effects of H2S on the Heart and Liver Tissues of T2DM Rats. Note.T2DM: Type 2 diabetes: H2S: Hydrogen sulphide; STZ: Streptozotocin. The T2DM model was induced by receiving a high-fat diet (35% fat, 24% protein, and 26% carbohydrate) for 60 days, and on the 61st day, while they were fasting for 12 hours, they received a single dose of STZ 40 mg/kg intraperitoneally, which was confirmed by a fasting glucose level of ≥ 150 mg/dL 3 days later. One day after the confirmation of diabetes, treatment was started with doses of 50 µM/kg H2S and 100 µM/kg H2S (daily intraperitoneally) and continued for 60 days. At the end of the experiment, biochemical and oxidative stress markers were measured using spectrophotometric methods. In addition, the liver tissue was histologically assessed
.
Experimental Time Line:Effects of H2S on the Heart and Liver Tissues of T2DM Rats. Note.T2DM: Type 2 diabetes: H2S: Hydrogen sulphide; STZ: Streptozotocin. The T2DM model was induced by receiving a high-fat diet (35% fat, 24% protein, and 26% carbohydrate) for 60 days, and on the 61st day, while they were fasting for 12 hours, they received a single dose of STZ 40 mg/kg intraperitoneally, which was confirmed by a fasting glucose level of ≥ 150 mg/dL 3 days later. One day after the confirmation of diabetes, treatment was started with doses of 50 µM/kg H2S and 100 µM/kg H2S (daily intraperitoneally) and continued for 60 days. At the end of the experiment, biochemical and oxidative stress markers were measured using spectrophotometric methods. In addition, the liver tissue was histologically assessed
Determination of Biochemical Parameters
The FBS was measured using a commercial glucometer through tail vein blood sampling. Insulin was measured using the enzyme-linked immunosorbent assay kit (RayBiotech). The insulin resistance index (homeostatic model assessment for insulin resistance: HOMA-IR) was calculated using the following formula (3):
HOMA-IR = Fasting insulin (μU /mL) × FBS (mg/dL)/405
Further, heart and liver enzymes, troponin I, total and direct bilirubin, and lipid profiles of serums were measured by the BT3000 device.
Determination of Oxidative Stress Biomarkers
To measure the levels of OS, the heart and liver tissues were homogenized with liquid nitrogen, mixed in a lysing buffer containing anti-protease, and kept on ice for 20 minutes. Furthermore, total oxidant status (TOS), total antioxidant capacity (TAC), malondialdehyde (MDA), and total thiol groups (TTG) were estimated calorimetrically (ZellBio GmbH, Ulm, Germany), according to the manufacturer’s instructions.
Liver Histology
For the histopathological analysis, the tissues were removed from all animals, and a small portion of liver tissue was fixed with 10% formalin and embedded in paraffin. Then, the serial sections (5-μm thick slices) were prepared and stained with hematoxylin and eosin (H&E), according to a previously published paper (10). The degree of fibrosis, hyperplasia of bile ducts, necrosis, and inflammation of the liver tissue were graded according to the METAVIR system (11).
Statistical Analysis
The data were analyzed by SPSS-16 software using analysis of variance and post-hoc analysis. Moreover, a repeated-measures test was used for parameters such as weight and FBS that were measured during the period, and P< 0.05 was considered statistically significant. Finally, the Kolmogorov-Smirnov test was utilized to confirm that the study variables were normal.
Results
Effects of Hydrogen Sulfide on Rats’ Body Weight
As shown in Figure 2, the body weight of groups treated with 50 µM/kg and 100 µM/kg H2S was elevated compared to that of diabetic rats, but this weight gain was not significant.
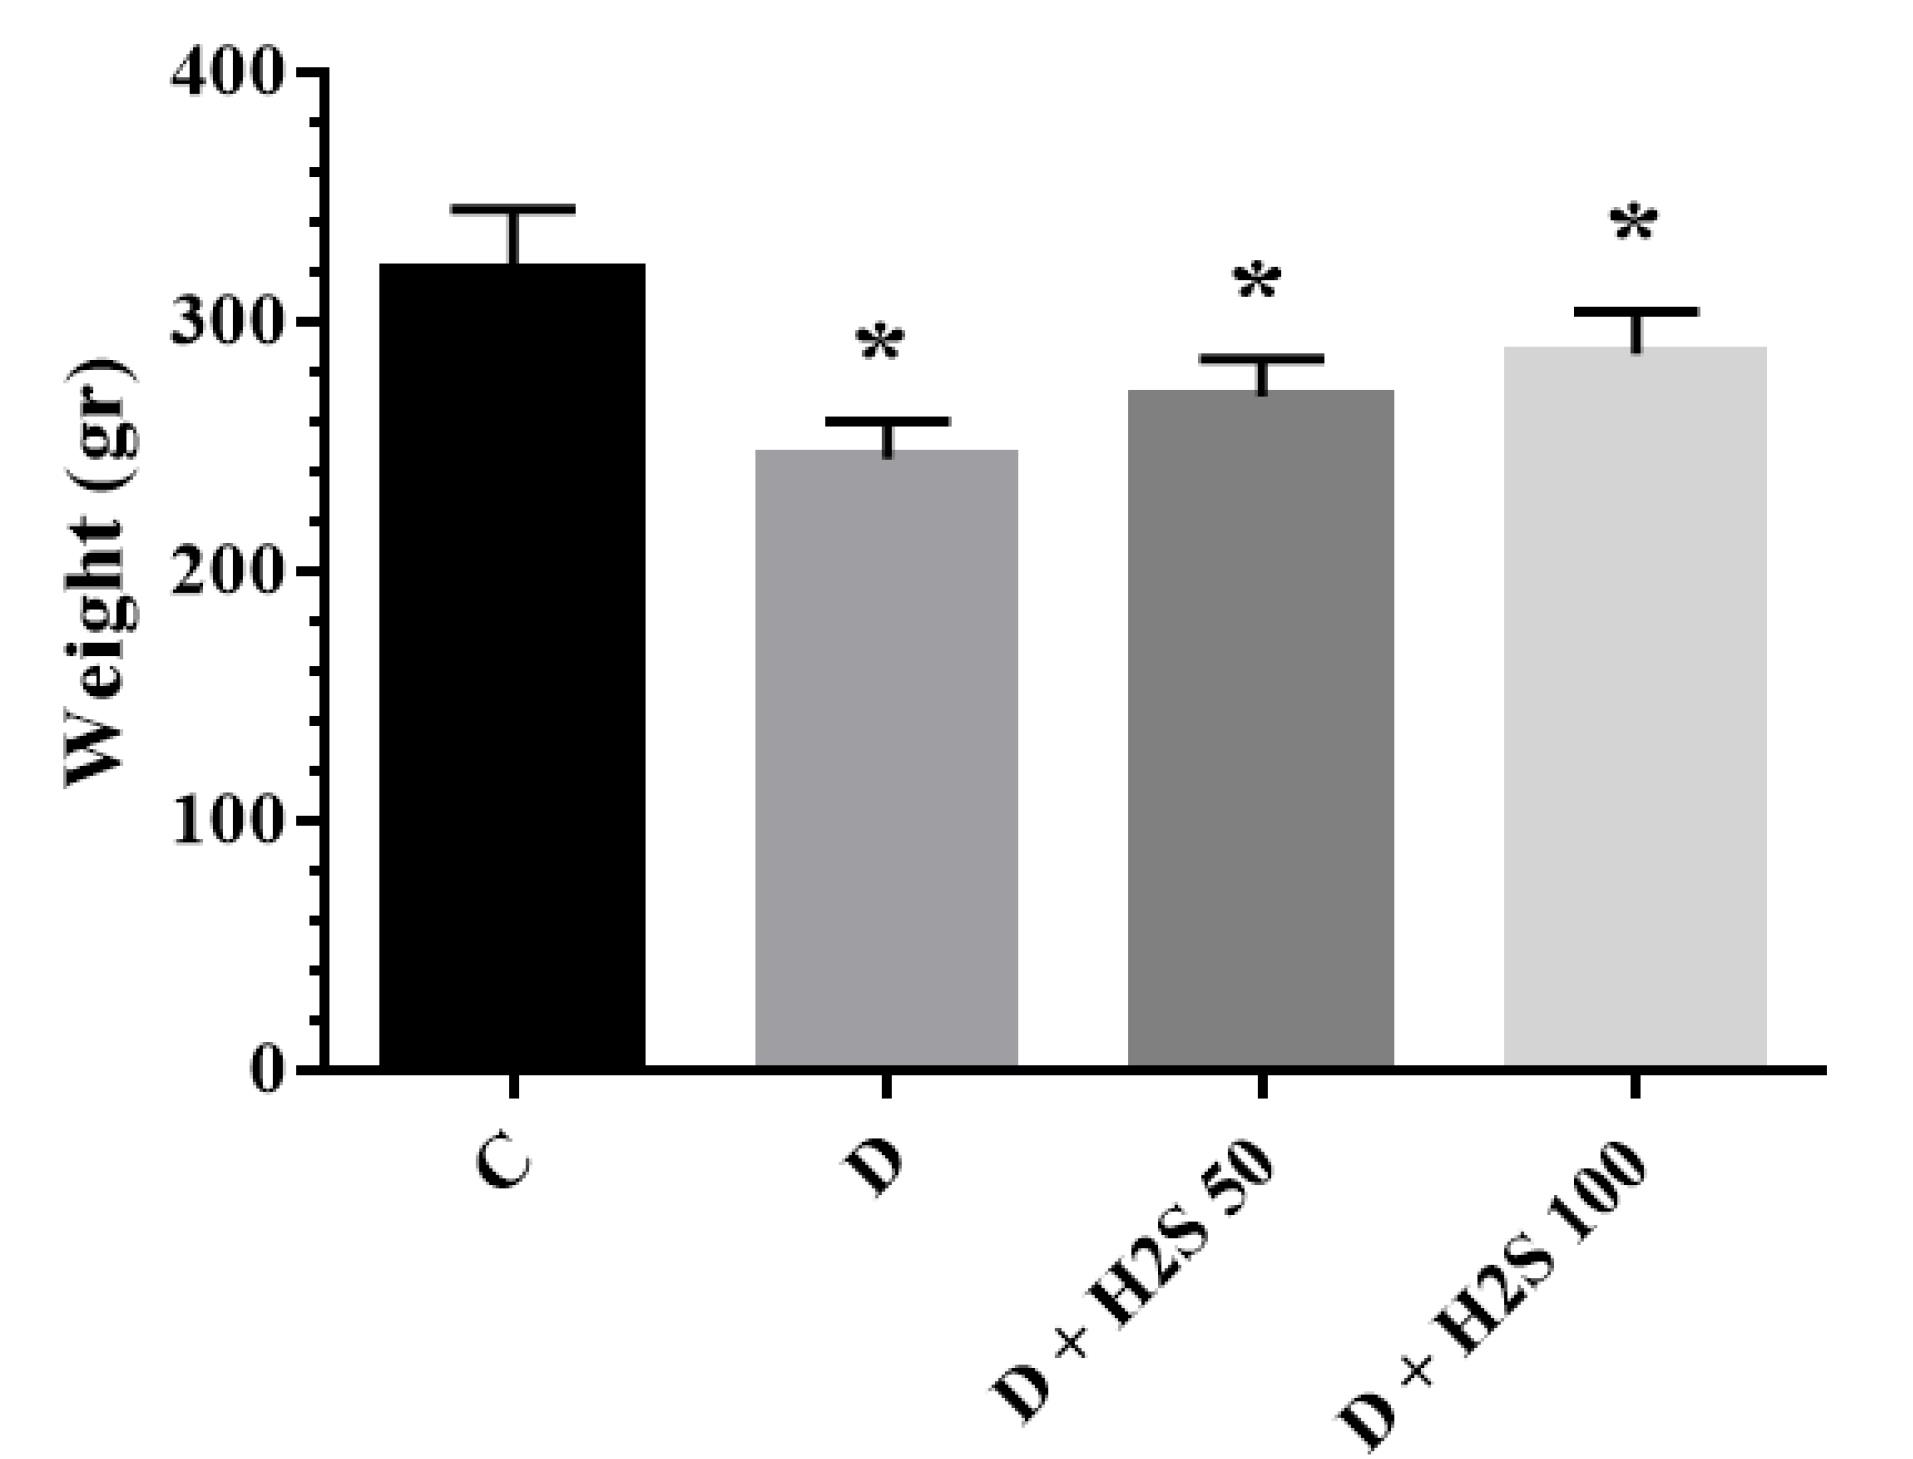
Figure 2.
The Weight of the Studied Groups at the End of the Experiment. Note. The results are presented as means ± standard errors. C: Healthy control; D: Diabetic; H2S: Hydrogen sulfide (50 µM/kg or 100 µM/kg); *: Significant comparison with group C
.
The Weight of the Studied Groups at the End of the Experiment. Note. The results are presented as means ± standard errors. C: Healthy control; D: Diabetic; H2S: Hydrogen sulfide (50 µM/kg or 100 µM/kg); *: Significant comparison with group C
Effects of Hydrogen Sulfide on Biochemical Parameters
The concentration of FBS in the treatment group with 50 µM/kg and 100 µM/kg H2S doses reduced markedly (P < 0.05) compared to the diabetic group. However, the FBS level was not reversed to the level of the control group (Figure 3). The results showed that insulin concentrations were significantly decreased in the diabetic group rats with 100 µM/kg H2S in comparison to the diabetic group (P< 0.05). HOMA-IR was significantly decreased in the diabetic groups treated with 50 µM/kg H2S and 100 µM/kg H2S when compared to diabetic control rats (P < 0.05, Table 1).
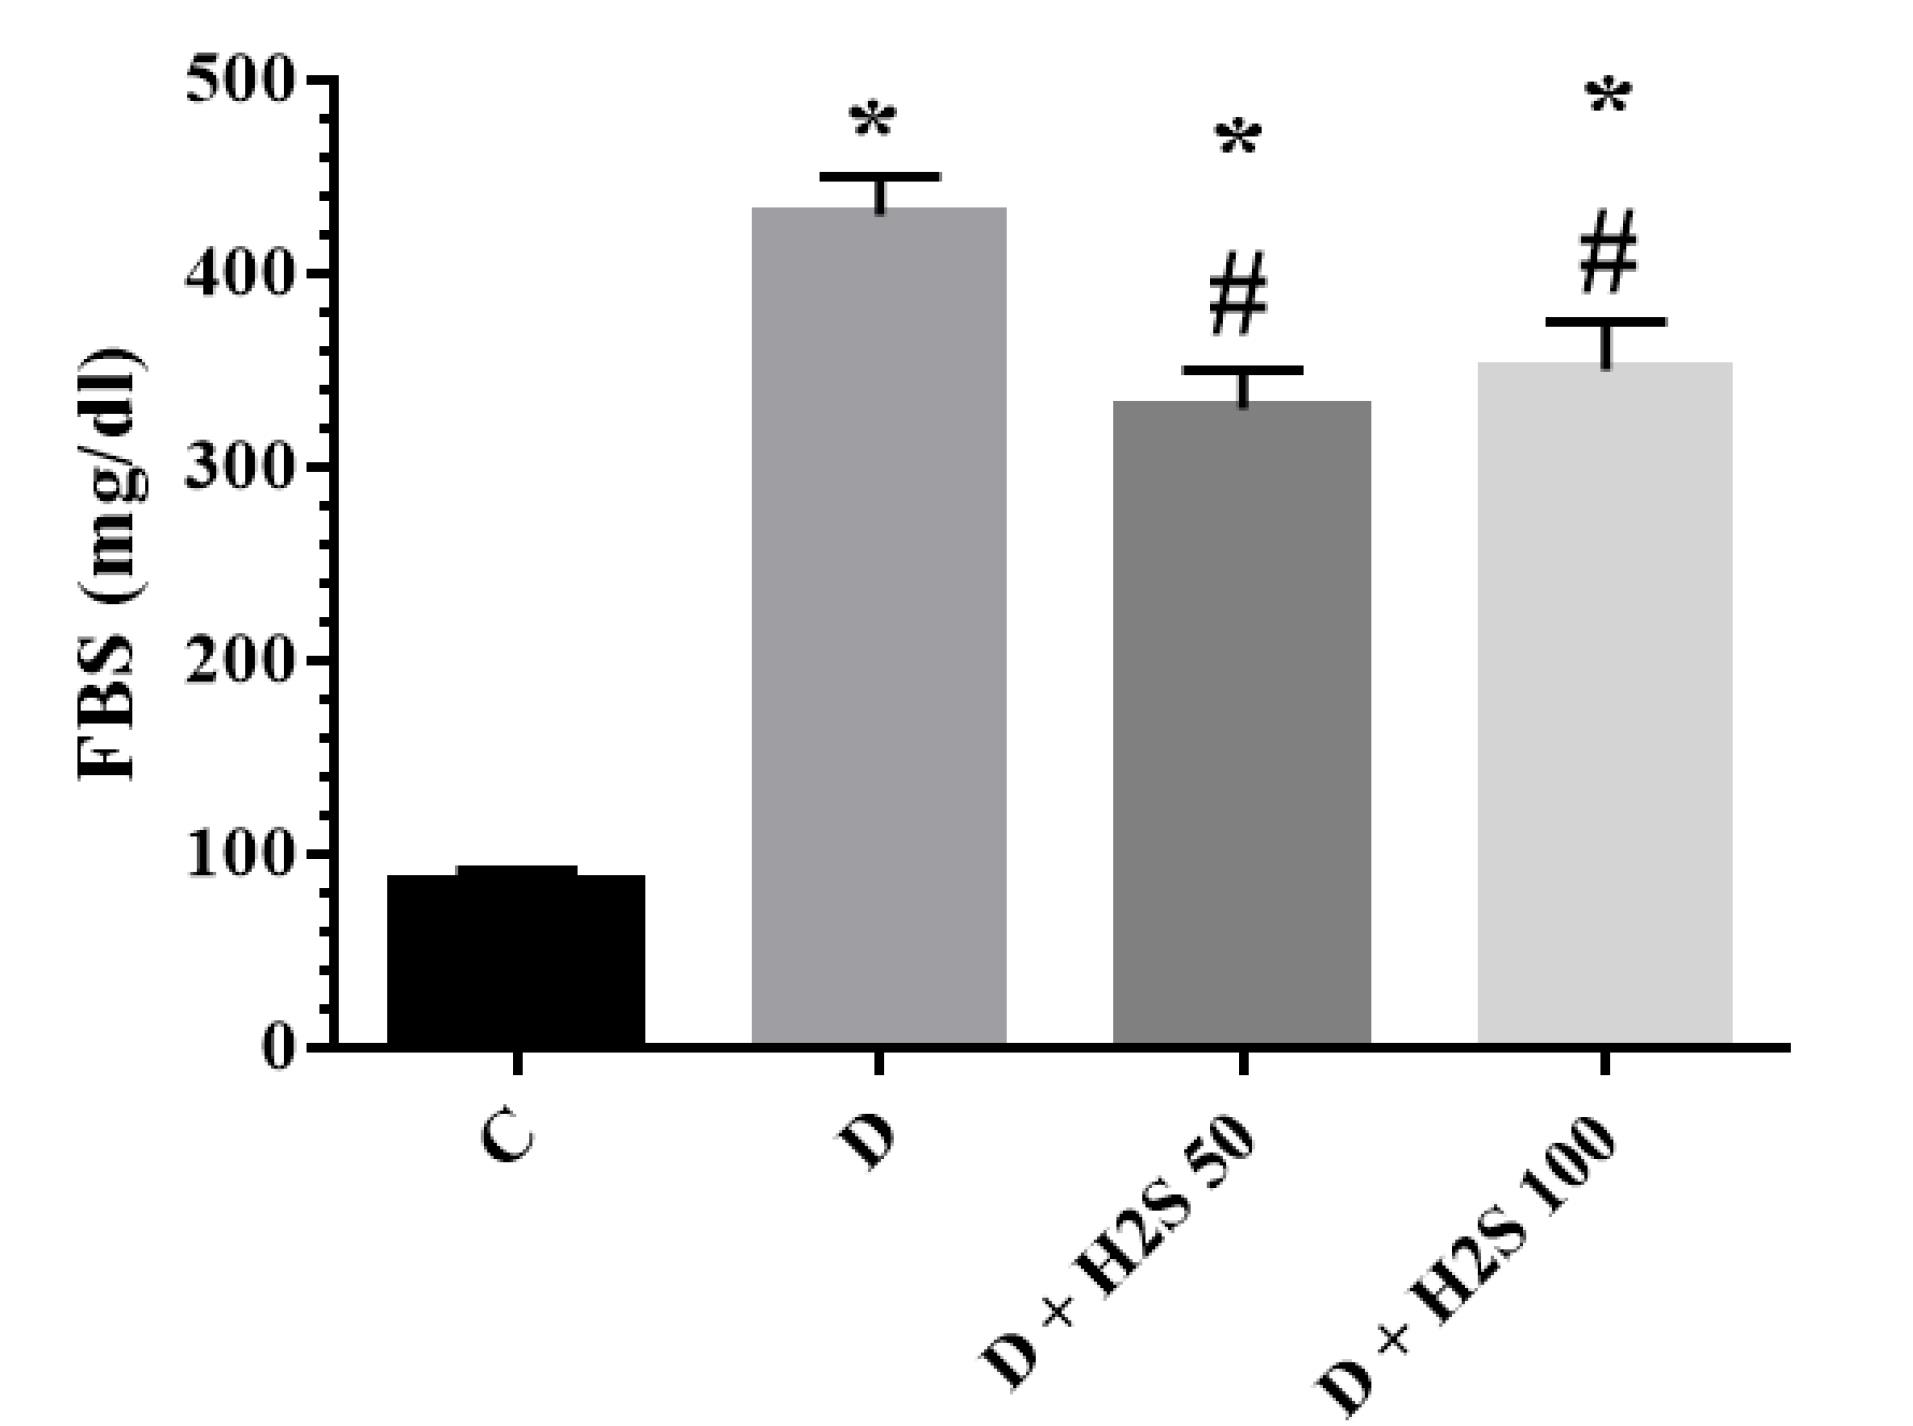
Figure 3.
The Fasting Blood Sugar of the Studied Groups at the End of the Experiment. Note. The results are presented as means ± standard error. C: Healthy control; D: Diabetic; H2S: Hydrogen sulfide (50 100 µM/kg or 100 µM/kg); *: Significant comparison with group C; #: Significant comparison with group D (P < 0.05)
.
The Fasting Blood Sugar of the Studied Groups at the End of the Experiment. Note. The results are presented as means ± standard error. C: Healthy control; D: Diabetic; H2S: Hydrogen sulfide (50 100 µM/kg or 100 µM/kg); *: Significant comparison with group C; #: Significant comparison with group D (P < 0.05)
Table 1.
Insulin, HOMA-IR, and Serum Biochemical Parameters of Studied Groups
|
Group parameters
|
C
|
D
|
D+H2S 50µM/kg
|
D+ H2S 100µM/kg
|
| Insulin (pmol/L) |
210.67 ± 12.63 |
109.31 ± 5.33a |
103.60 ± 10.99a |
81.65 ± 8.85ab |
| HOMA-IR |
45.77 ± 4.04 |
98.30 ± 6.96a |
90.20 ± 11.55a |
74.60 ± 12.80ab |
| Cholesterol(mg/dL) |
40.42 ± 7.81 |
56.01 ± 6.27 |
38.80 ± 5.77b |
38.21 ± 1.92b |
| Triglyceride (mg/dL) |
63.05 ± 21.15 |
61.35 ± 13.47 |
35.42 ± 10.71a |
28.61 ± 13.57ab |
| HDL-C (mg/dL) |
25.85 ± 3.85 |
19.21 ± 2.21a |
20.00 ± 3.58a |
19.21 ± 2.62a |
| LDL-C (mg/dL) |
11.61 ± 2.65 |
17.65 ± 3.21a |
11.43 ± 1.21b |
11.41 ± 2.07b |
| Atherogenic index (TG/HDL-C) |
2.49 ± 0.87 |
3.67± 0.55 |
1.67 ± 0.39b |
1.53 ± 0.80b |
| Bili-total (mg/dL) |
40.23±1.96 |
42.67± 2.00 |
42.45 ± 2.21 |
40.12±2.01 |
| Bili-direct (mg/dL) |
0.1± 0.01 |
0.12 ± 0.02 |
0.12 ± 0.00 |
0.1±0.00 |
Note. HOMA-IR: Homeostatic model assessment for insulin resistance. The results are presented as means ± standard errors. HDL-C: High-density lipoprotein cholesterol; LDL-C: Low-density lipoprotein cholesterol; TG: Triglyceride; C: healthy control, D: Diabetic; H2S: Hydrogen sulfide (50 µM/kg or 100 µM/kg); HOMA-IR: Homeostasis assessment model of insulin resistance.
asignificant comparison with group C;
bsignificant comparison with group D (P< 0.05).
The findings related to lipid parameters are provided in Table 1. In this study, triglyceride, low-density lipoprotein (LDL), and the atherogenic index were significantly increased in diabetic rats’ cholesterol. On the other hand, treatment with 50 µM/kg and 100 µM/kg H2S caused a significant decrease in cholesterol, LDL, and atherogenic index (P < 0.05). Additionally, treatment with 100 µM/kg H2S led to a significant decrease in triglyceride levels (P < 0.05). There was no significant difference in HDL levels in the diabetic group compared to the H2S-treated groups. In this study, no significant change was observed in total and direct bilirubin concentrations (Table 1).
According to the results, CK-MB, LDH, and troponin I levels were higher in the diabetic group than in the other 3 groups. In the H2S-treated groups, this level was close to that of the control group, but there was no significant difference in the other groups (Figure 4). The levels of ALT and ALP enzymes in the diabetic group increased compared to the control group (P < 0.05). The amount of AST, ALT, and ALP enzymes in the treatment groups decreased in comparison to the diabetic rats, but this decrease was not significant (Figure 5).
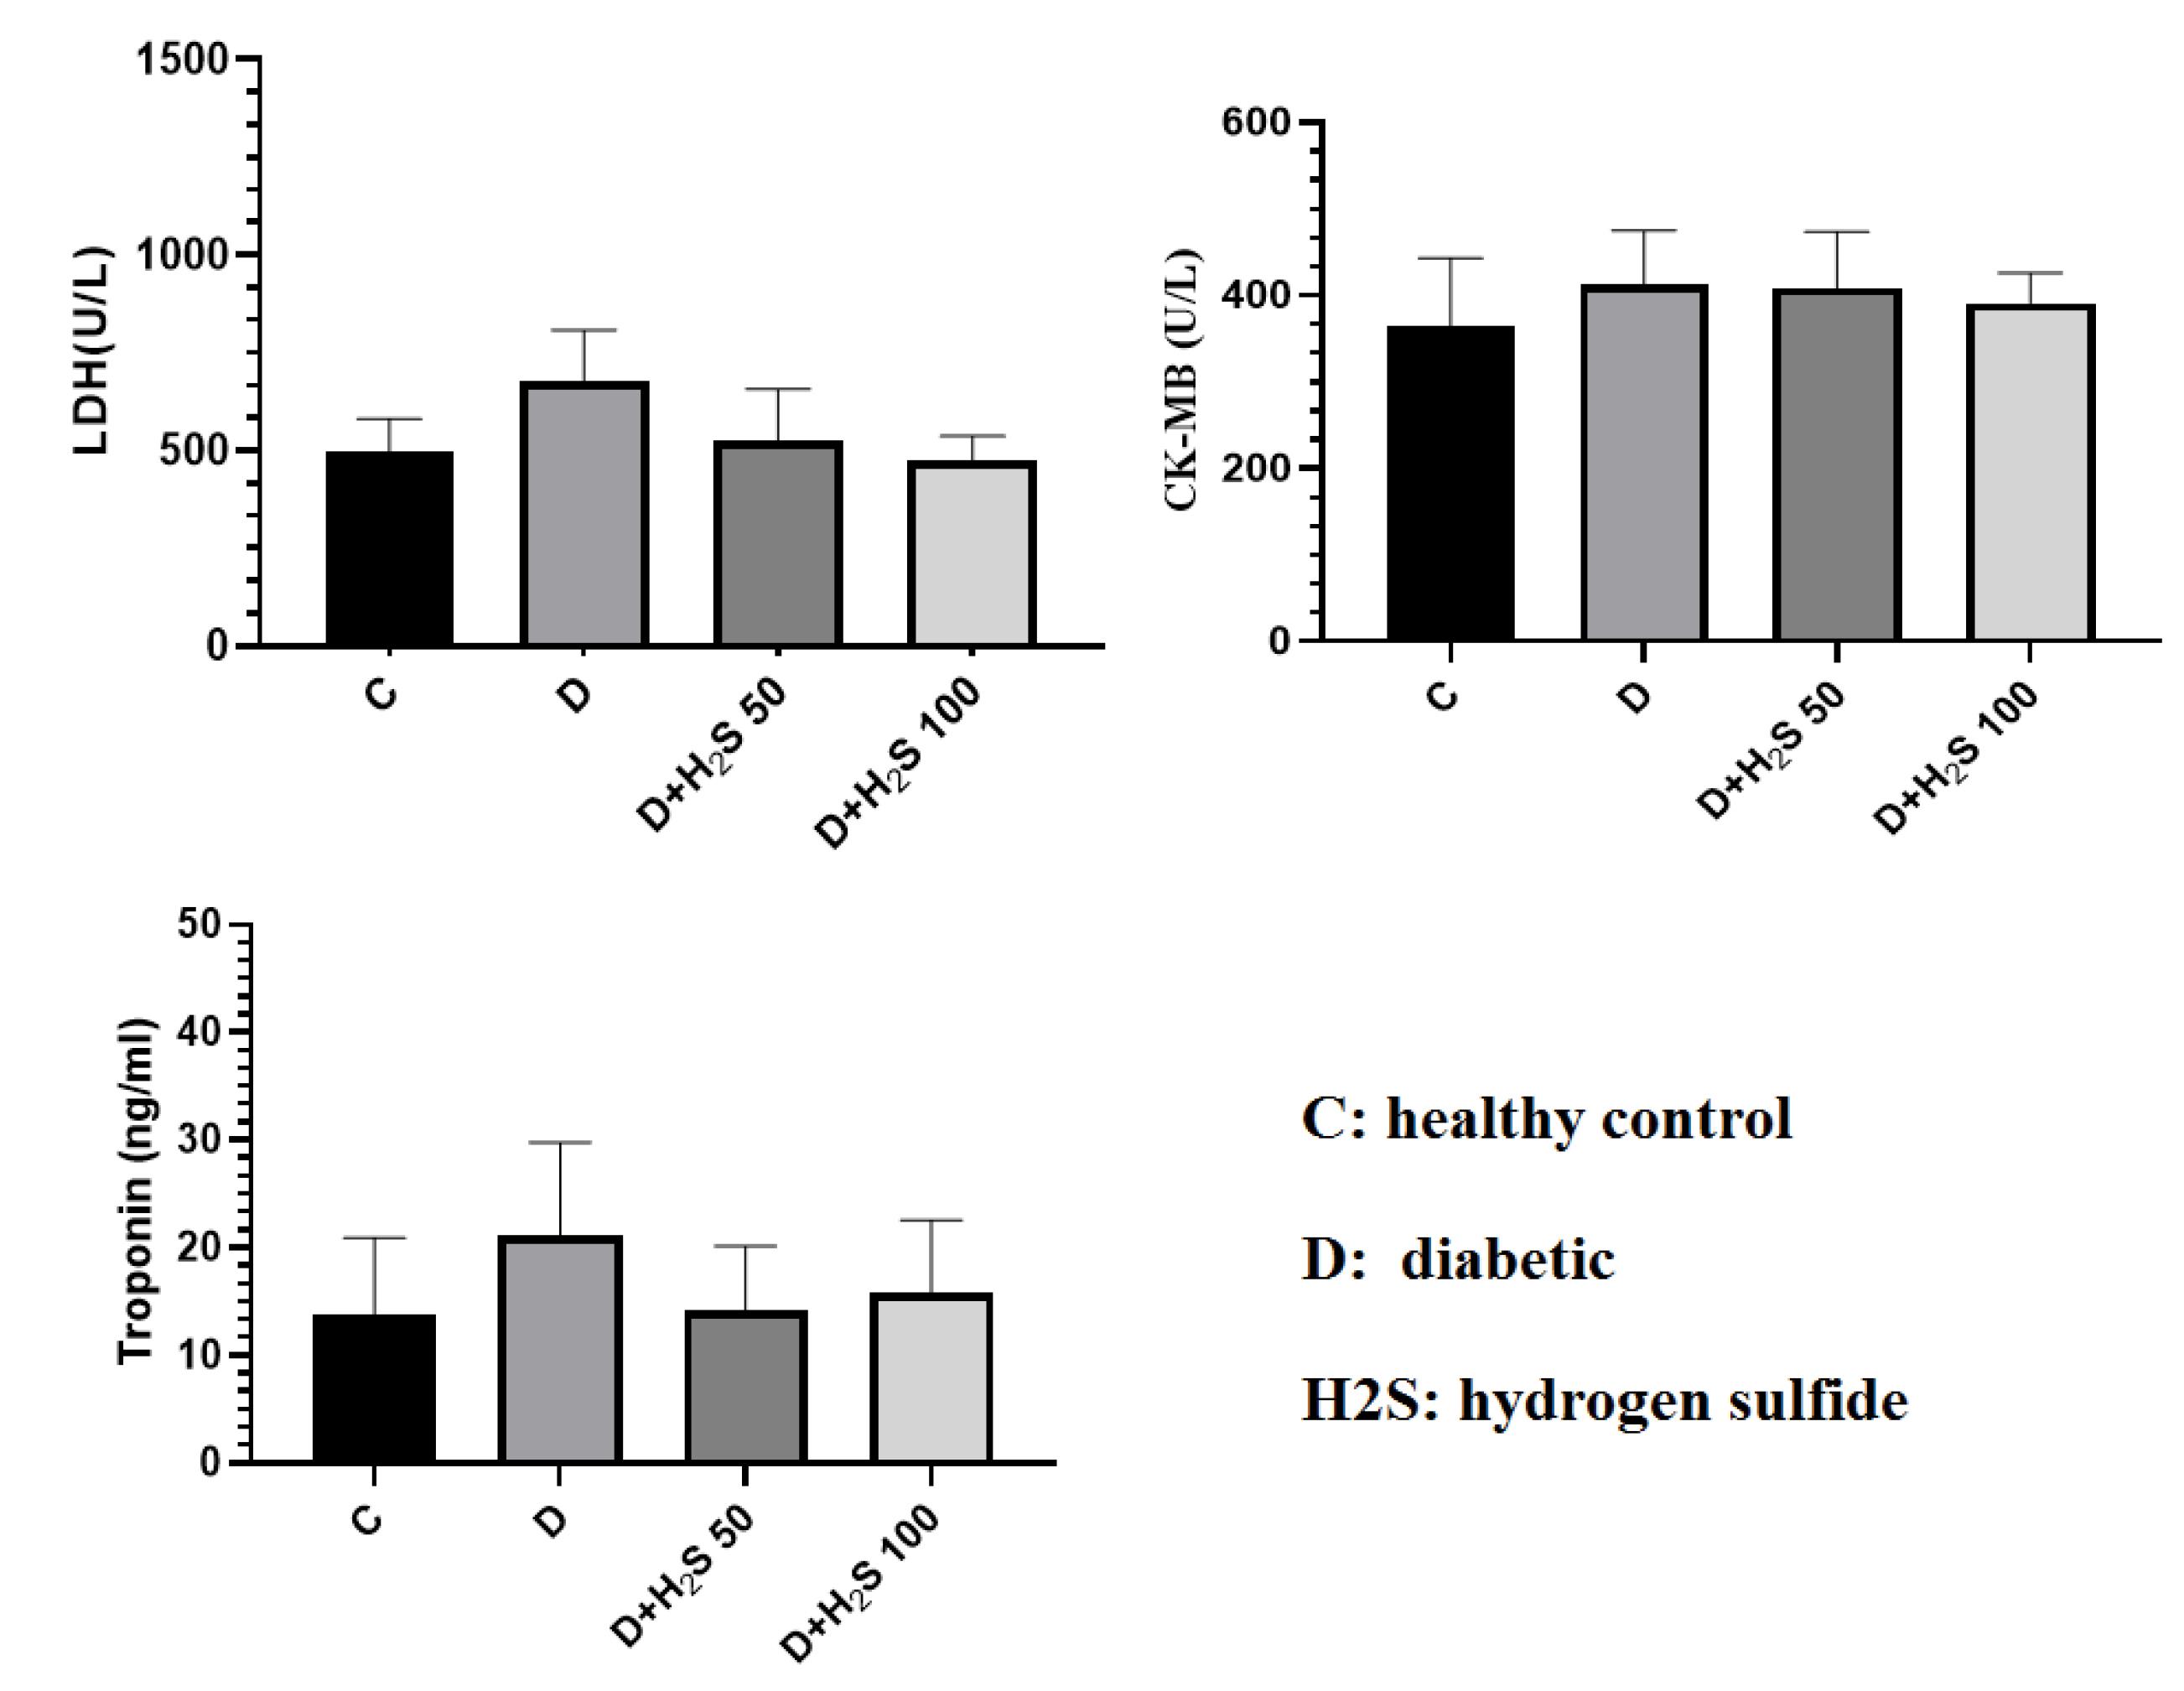
Figure 4.
The Effect of H2S on the Amount of Cardiac Enzymes and Troponin I in the Serum. Note. The results are presented as means ± standard errors. C: Healthy control; D: Diabetic; H2S: Hydrogen sulfide (50 µM/kg or 100 µM/kg); LDH: Lactate dehydroogenase; CK-MB: Creatine kinase MB
.
The Effect of H2S on the Amount of Cardiac Enzymes and Troponin I in the Serum. Note. The results are presented as means ± standard errors. C: Healthy control; D: Diabetic; H2S: Hydrogen sulfide (50 µM/kg or 100 µM/kg); LDH: Lactate dehydroogenase; CK-MB: Creatine kinase MB
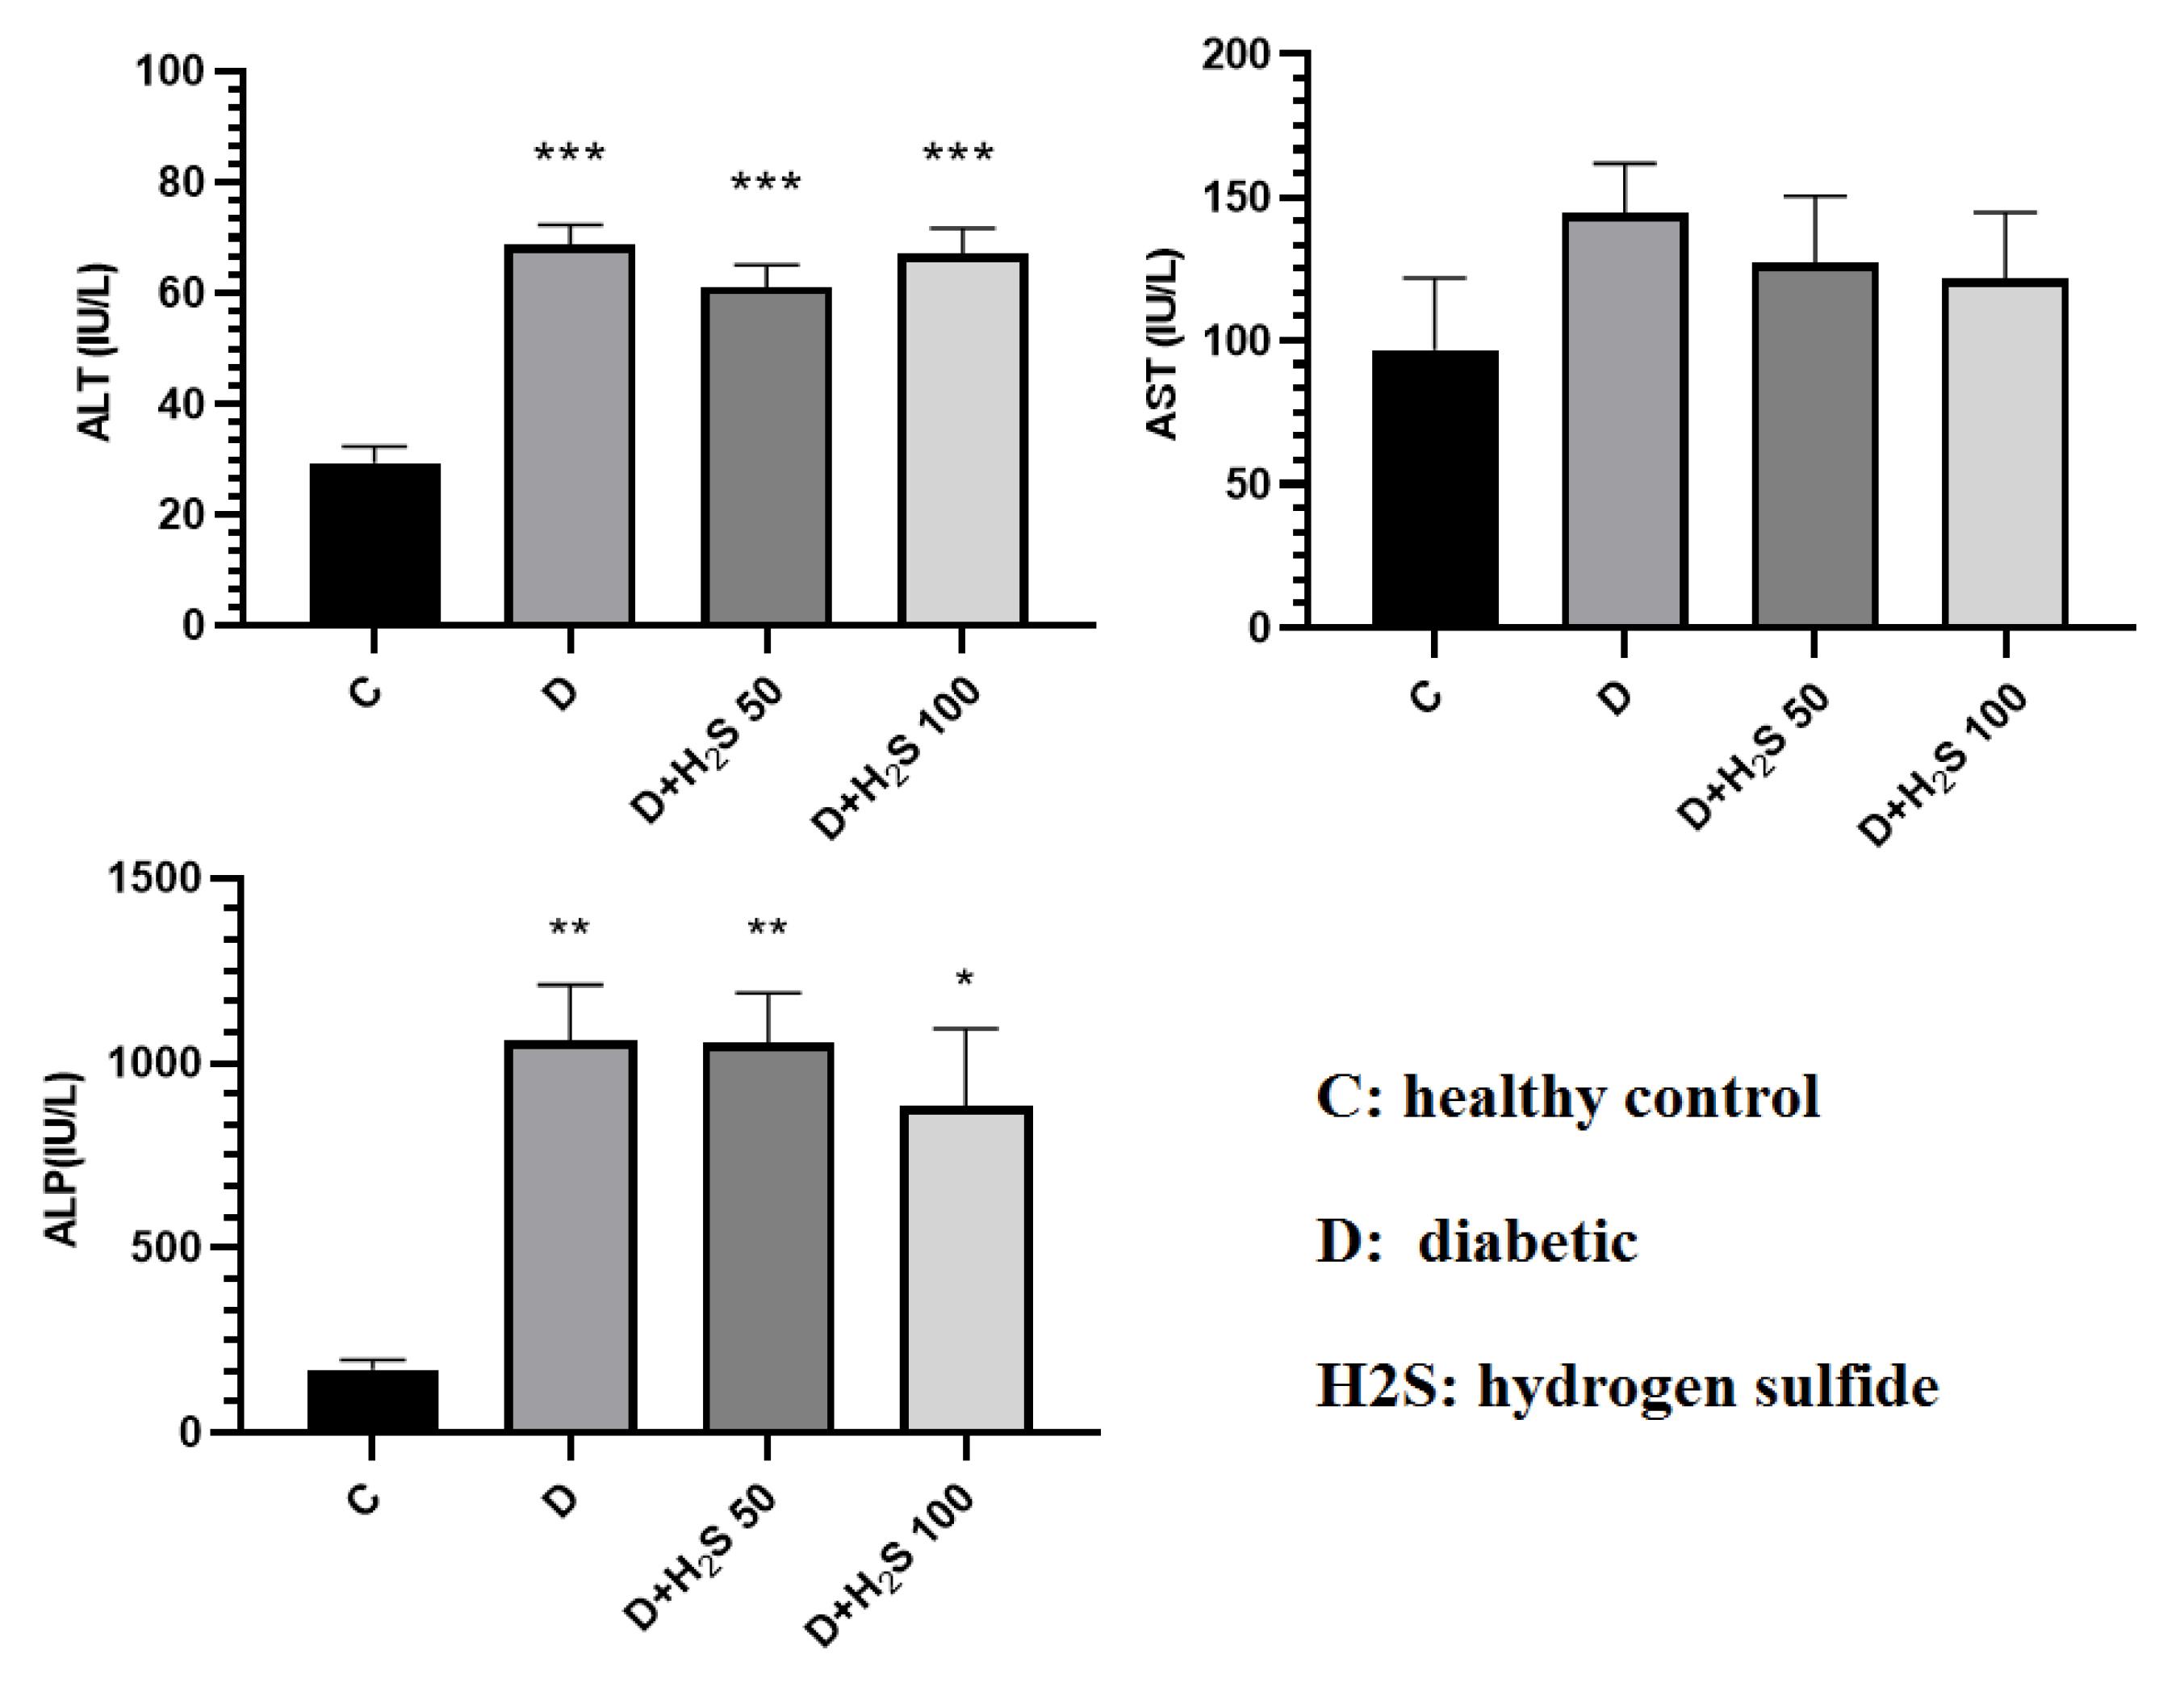
Figure 5.
The Effect of H2S on the Amount of Liver Enzymes (ALT, ALP, and AST) in the Serum. Note. ALT: Alanine transaminase; ALP: Alkaline phosphatase; AST: Aspartate aminotransferase. The results are expressed as means ± standard errors. C: Healthy control; D: Diabetic; H2S: Hydrogen sulfide (50 µM/kg or 100 µM/kg); * Significant comparison with group C (P< 0.05)
.
The Effect of H2S on the Amount of Liver Enzymes (ALT, ALP, and AST) in the Serum. Note. ALT: Alanine transaminase; ALP: Alkaline phosphatase; AST: Aspartate aminotransferase. The results are expressed as means ± standard errors. C: Healthy control; D: Diabetic; H2S: Hydrogen sulfide (50 µM/kg or 100 µM/kg); * Significant comparison with group C (P< 0.05)
Effects of Hydrogen Sulfide on Oxidative Stress Biomarkers
In the present study, OS was evaluated by detecting the content of TAC, TOS, MDA, and TTG in the heart and liver by spectrophotometric methods. The amount of TAC in the heart and liver tissues decreased in the diabetic animals compared to the control group, and H2S increased the TAC in comparison to diabetic group, but these changes were not significant. The results showed that the amount of TOS in the heart and liver tissue in the diabetic rats increased compared to the control group. Based on the results, the TOS concentration decreased in the groups treated with doses of 50 µM/kg and 100 µM/kg H2S compared to both the control and diabetic groups. However, this change was not statistically significant. The amount of MDA in the heart and liver tissues in the diabetic group increased compared to the control group, but it was not significant. Conversely, the MDA level was reduced in the heart and liver tissues of groups treated with 50 µM/kg and 100 µM/kg H2S doses compared to the diabetes group, but only the treatment group with 100 µM/kg H2S was significant compared to the diabetic group (P < 0.05).
TTG levels in the heart and liver tissues of the diabetic group were reduced compared to the control rats. Moreover, TTG increased in the treatment groups compared to the diabetic group; however, this change was not statistically significant (P> 0.05, Figures 6 and 7).
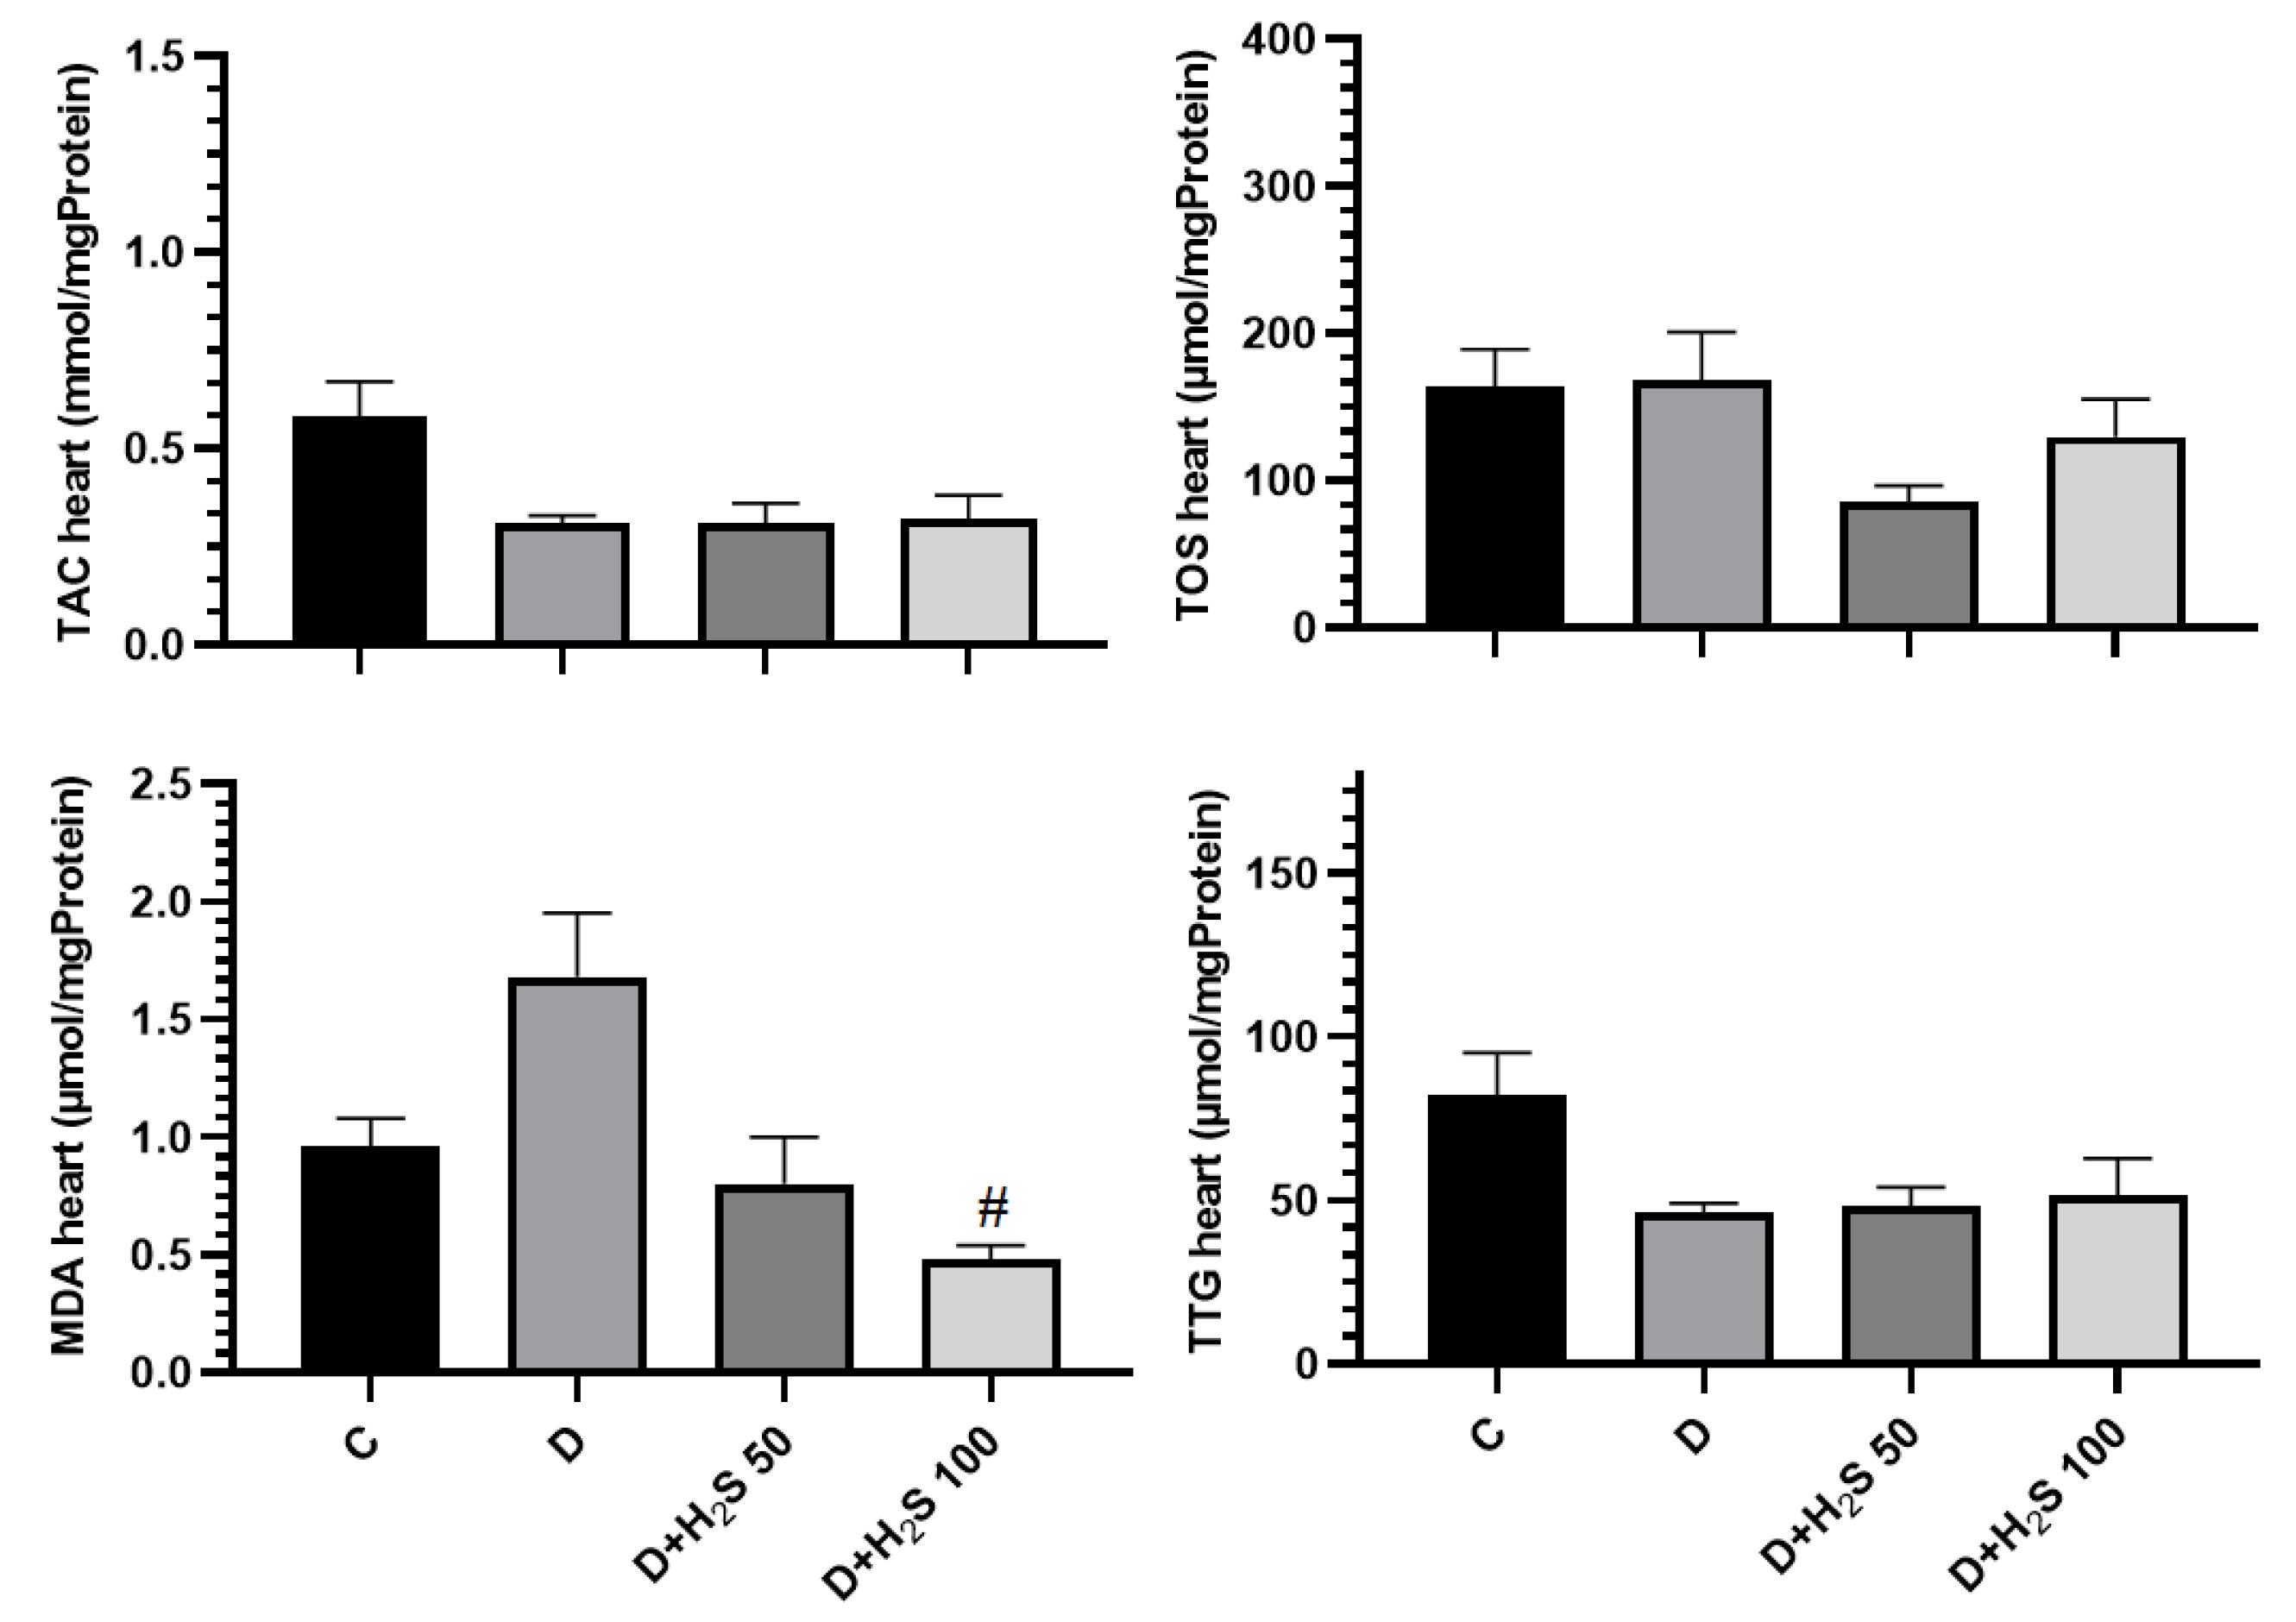
Figure 6.
The Effect of H2S on the Amount of Oxidative Stress Parameters in the Heart Tissue. Note. The results are presented as means ± standard errors. C: Healthy control; D: Diabetic; H2S: Hydrogen sulfide (50 µM/kg or 100 µM/kg); TAC: Total antioxidant capacity; TOS: Total oxidative status; MDA: Malondialdehyde; TTG: Total thiol groups; #Significant comparison with group D (P < 0.05)
.
The Effect of H2S on the Amount of Oxidative Stress Parameters in the Heart Tissue. Note. The results are presented as means ± standard errors. C: Healthy control; D: Diabetic; H2S: Hydrogen sulfide (50 µM/kg or 100 µM/kg); TAC: Total antioxidant capacity; TOS: Total oxidative status; MDA: Malondialdehyde; TTG: Total thiol groups; #Significant comparison with group D (P < 0.05)
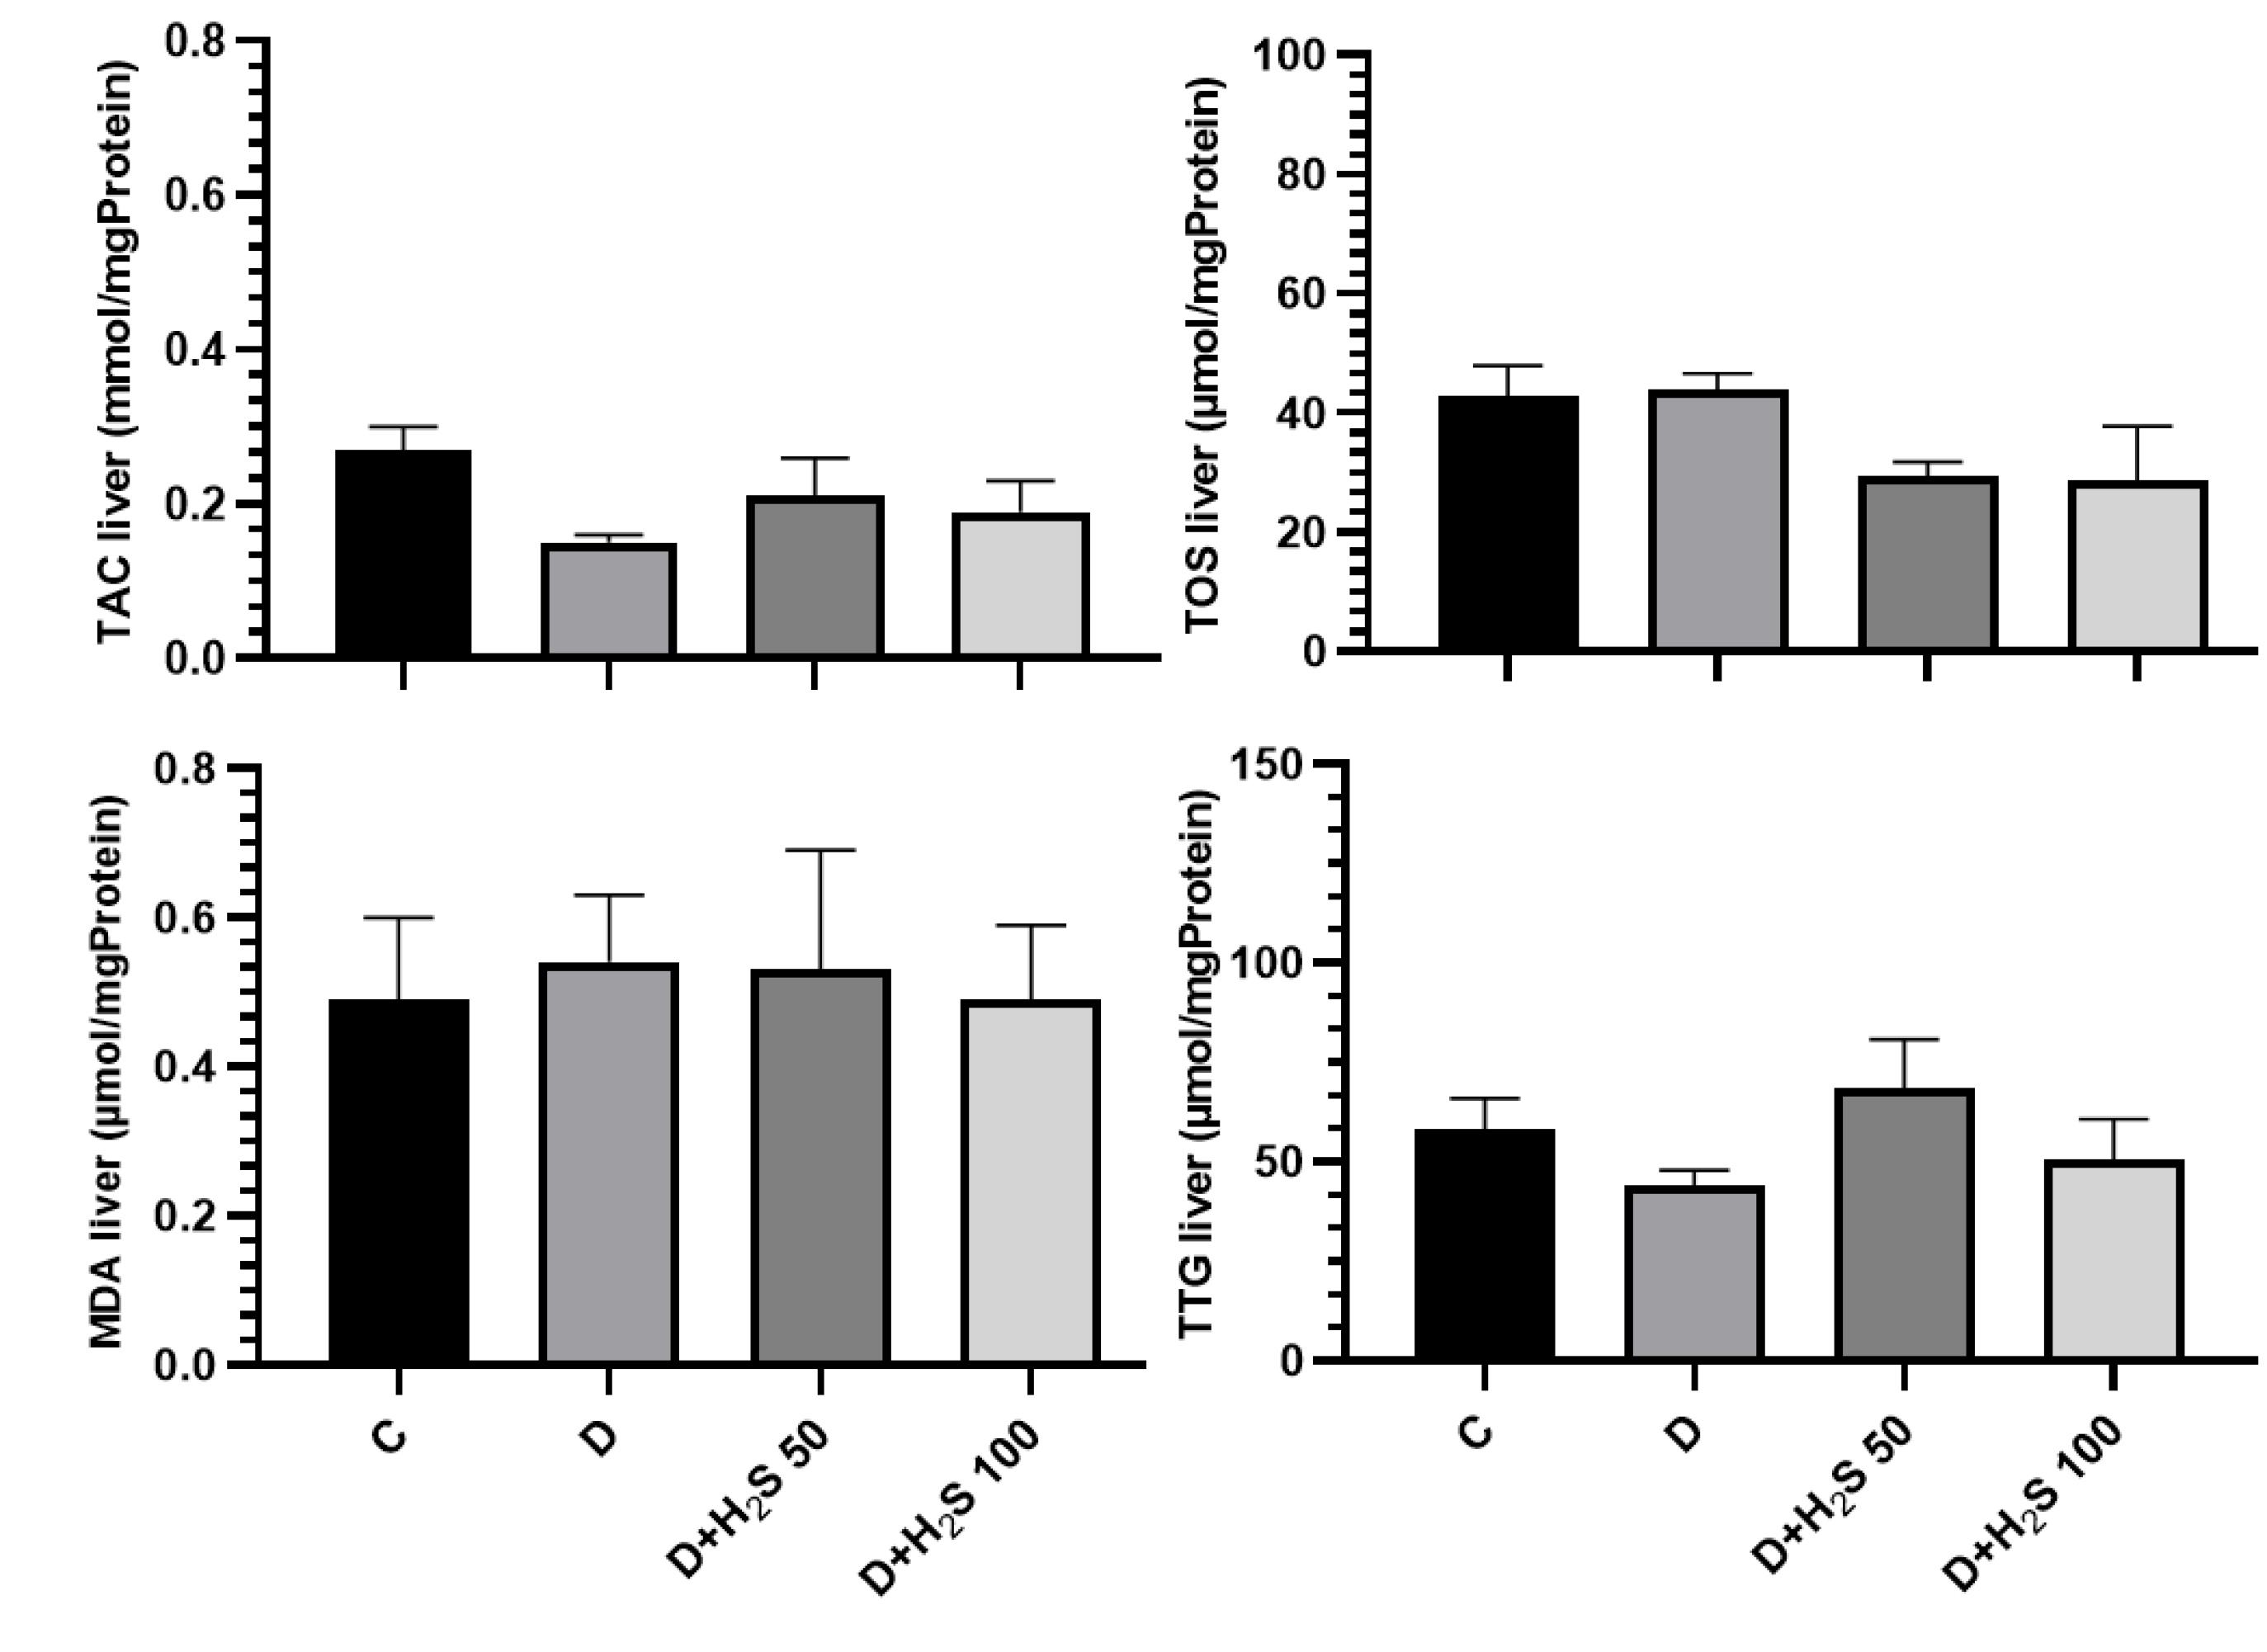
Figure 7.
The Effect of H2S on the Amount of Oxidative Stress Parameters in the Liver Tissue. Note. The results are provided as means ± standard errors. C: Healthy control; D: Diabetic; H2S: Hydrogen sulfide (50 µM/kg or 100 µM/kg); TAC: Total antioxidant capacity; TOS: Total oxidative status; MDA: Malondialdehyde; TTG: Total thiol groups
.
The Effect of H2S on the Amount of Oxidative Stress Parameters in the Liver Tissue. Note. The results are provided as means ± standard errors. C: Healthy control; D: Diabetic; H2S: Hydrogen sulfide (50 µM/kg or 100 µM/kg); TAC: Total antioxidant capacity; TOS: Total oxidative status; MDA: Malondialdehyde; TTG: Total thiol groups
Liver Histological Observations
In this study, after processing the liver tissue and staining it with H&E, the degree of liver tissue damage was graded according to the METAVIR system. A small amount of focal lymphocytes was observed in some parts of the liver tissue of the diabetic control group. The results of the liver tissue examination revealed inflammation, fat deposition, liver fibrosis, and other tissue changes in the sections of the liver of diabetic rats. The livers of the treated diabetic rats with low and high doses of H2S demonstrated improvements in structure, inflammation, fat deposition, and liver fibrosis compared to those of the untreated diabetic rats (Figure 8).
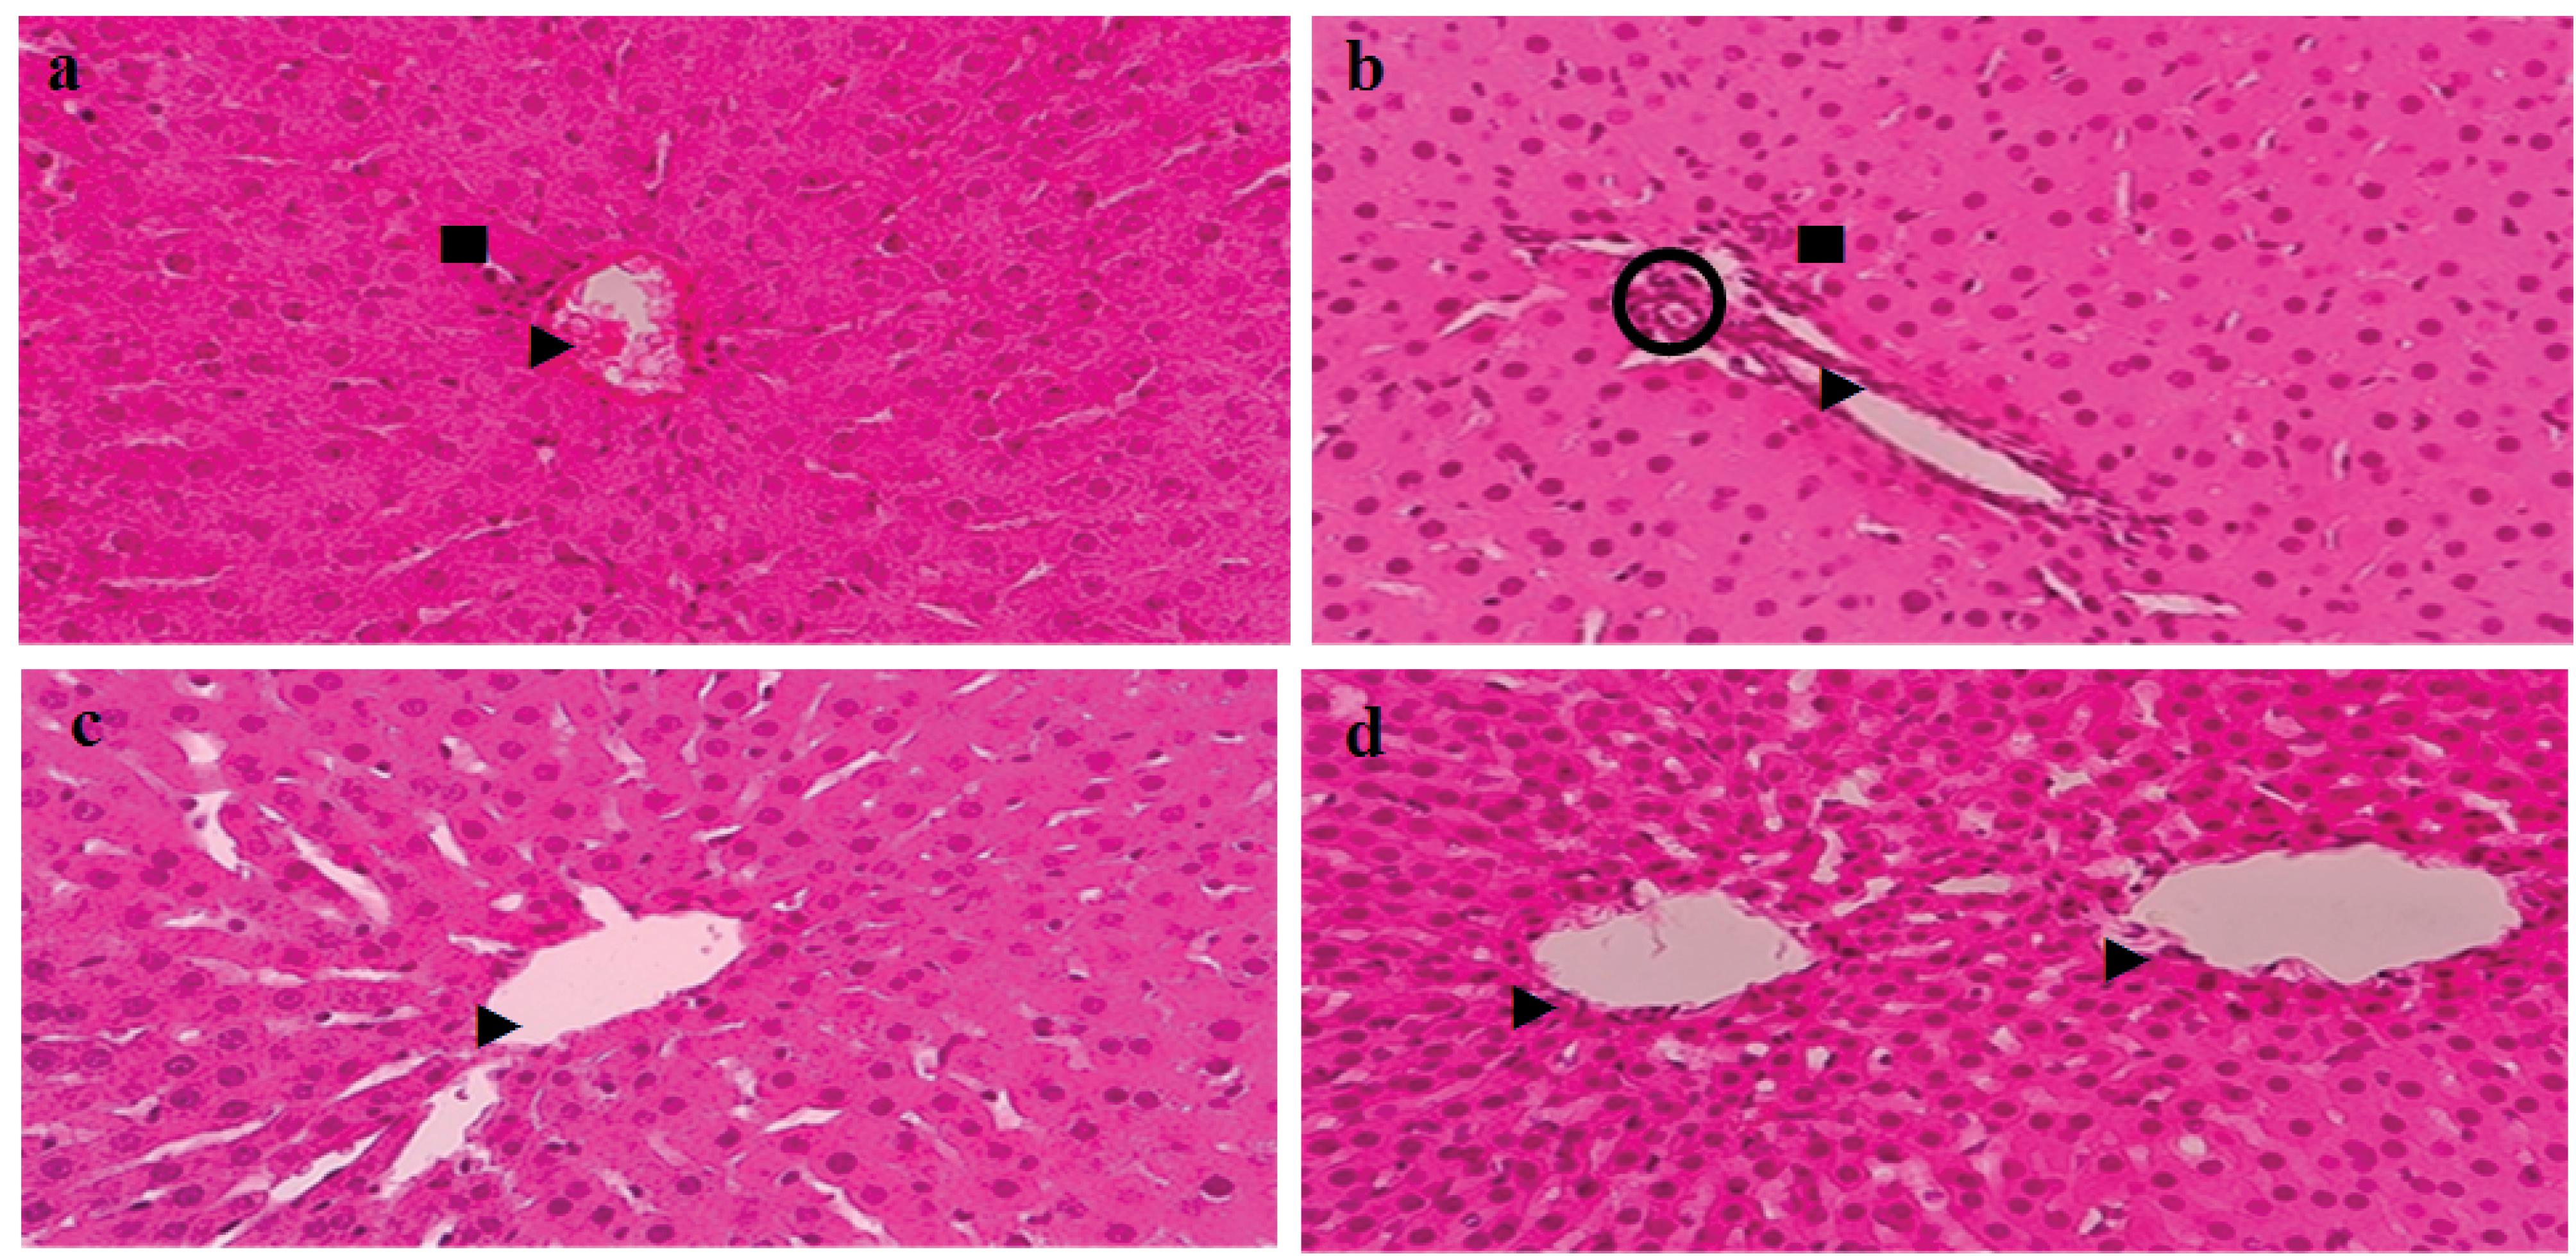
Figure 8.
Images of Liver Tissue Sections Stained With Hematoxylin and Eosin. Note. 1 mm magnification × 400. ►: Bile ducts; ■: Focal accumulation of lymphocytes; O: Hepatic artery. a: Healthy control; b: Diabetic; c: Hydrogen sulfide (50 µM/kg) and d: Hydrogen sulfide (100 µM/kg)
.
Images of Liver Tissue Sections Stained With Hematoxylin and Eosin. Note. 1 mm magnification × 400. ►: Bile ducts; ■: Focal accumulation of lymphocytes; O: Hepatic artery. a: Healthy control; b: Diabetic; c: Hydrogen sulfide (50 µM/kg) and d: Hydrogen sulfide (100 µM/kg)
Discussion
The research findings indicated that plasma H2S concentrations decreased in DM patients. A decrease was found in the levels of H2S related to the pathogenesis of DM. Bahadoran et al reported that H2S levels decreased in diabetic patients (12). Similarly, Suzuki et al concluded that the amount of H2S was reduced in T2DM patients (13), and Dutta et al reported that the concentration of H2S was reduced in type 2 diabetic rats by using STZ. On the other hand, the findings revealed that increases in H2S levels are linked to a decrease in the FBS concentration (14). Therefore, considering the beneficial effects of H2S in many studies and the reduction of this compound in diabetes, this research investigated the effect of H2S in the heart and liver tissues of HFD/low-dose STZ T2DM rats.
Weight loss in T2DM-induced rats was due to muscle wasting and loss of muscle protein. The result of the present study showed the weight of diabetic rats decreased significantly in comparison with the control group, and treatment with 50 and 100 µM/kg H2S, elevated body weight compared to the diabetic group. Consistent with our expectations, Cai et al and Yang et al indicated that treatment with H2S or an increase in endogenous H2S biosynthesis could increase fat mass accumulation in mice and fruit flies, whereas the decrease of endogenous H2S biosynthesis prevented HFD-induced fat mass (15,16).
The results of this study revealed that the FBS level in diabetic animals was significantly increased compared to control rats. However, our findings confirmed that treatment with H2S 100 µM/kg/day for 60 days significantly reduced FBS, insulin, and insulin resistance. Previous studies indicated that STZ enters pancreatic β cells through the glucose transporter (GLUT2) and leads to DNA damage, causing increased activity of the poly (ADP-ribose) polymerase 1 enzyme to repair DNA. Poly ADP-ribosylation leads to the depletion of cellular NAD + and ATP inside β cells. Decreased levels of ATP inhibit insulin synthesis and secretion by pancreatic beta cells (17,18). Several studies reported the protective role of H2S in regulating pancreatic β-cell function. Interestingly, H2S can regulate energy homeostasis and glucose metabolism through various mechanisms in adipose tissue, the pancreas, skeletal muscle, and the liver (19). Kaneko et al demonstrated that NaHS (100 μmol/L) reduced high glucose concentrations while increasing glutathione levels in the mouse islet β cell line (20). It has also been shown that H2S inhibits the inflammatory or oxidative signaling pathways of pancreatic cells (21).
Based on the results of the current study, the lipid profile in the H2S-treated groups was improved than that in the diabetic group. Studies have reported different molecular mechanisms for the effect of H2S on lipid profile; in human adipocytes and Wistar rats, diallyl sulfide was an H2S donor, which down-regulated the mRNA and protein expression of lipolytic genes, such as hormone-sensitive lipase and adipose triglyceride lipase, whereas it increased the expression of lipogenic genes, such as PPARγ, thereby reducing free fatty acid release (22).
The findings of the current research revealed that liver and heart enzymes improved in the treated groups compared to the diabetic group. In agreement with these findings, Gheibi et al and Jeddi et al observed that the amount of ALP, AST, and ALT increased significantly in diabetic groups. In addition, the amount of these enzymes in the diabetic group treated with NaHS was reduced compared to the diabetic group (23,24). Moreover, a study reported that H2S alleviates liver function and decreases inflammation and OS. H2S significantly decreased serum levels of ALP, AST, ALT, hepatic MDA, total bilirubin, and expression of protein kinase B, lipocalin-2, transforming growth factor-beta, and alpha-smooth muscle actin (25).
Our findings showed that treatment with H2S for 60 days reduced the heart enzyme, but this change was not statistically significant. Multiple studies have also demonstrated that H2S has protective effects on the heart against hypertrophy, myocardial infarction, arrhythmia, heart failure, ischemia-reperfusion injury, and fibrosis. Some cardioprotective effects of H2S are antioxidative action, preservation of mitochondrial function, reduction of angiogenic actions, apoptosis, inflammation, and increased production of nitric oxide (4). In their study on the effect of H2S on ischemia in diabetic rats, Peake et al observed that the troponin I level after stroke was significantly lower in rats that received H2S before stroke compared to the diabetic group (26). In the study of Liu et al, the level of CK-MB in diabetic rats that received NaHS was lower than in the diabetic control group (27). The amount of LDH and CK-MB in the study of Ansari et al was higher in the diabetic group receiving HFD than in the group treated with 20 μM NaHS after stroke (28).
The obtained data confirmed the antioxidant effects of H2S regarding protecting the liver and heart from OS. T2DM causes an increase in lipid peroxidation and OS in the liver and heart tissue, which is associated with an increase in parameters such as MDA and TOS. On the other hand, it reduces the amount of TAC and GSH, which are antioxidants (29). In the research on the effect of H2S on the progression of diabetic cardiomyopathy by Zhou et al, higher levels of MDA and lower thiol groups were found in the heart tissue of the diabetic groups compared to the diabetic group receiving H2S (30), which is in line with the results of the study by Liu et al (31). Olas and Wachowicz concluded that H2S could protect neurons by reducing the levels of MDA and reactive oxygen species. Furthermore, H2S could inhibit the peroxynitrite (ONOO−) formation (32). The results of the current study also represented that heart tissue MDA in H2S 100 µM/kg/day was significantly lower than that in diabetic animals. The results of the present study also revealed that H2S improved the TAC, TOS, and TTG in the liver and heart of the diabetic group, but these changes were not significant.
It has been shown in many studies that people with diabetes are more exposed to liver inflammation and fibrosis than others, and in humans, diabetes is a strong factor in the development of fibrosis, followed by the development of hepatocellular carcinoma (33). Rajapaksha et al, by examining the liver tissue, concluded that the METAVIR degree of inflammation and liver fibrosis in diabetic rats was related with HFD increases (34). After staining the liver tissue with H&E and examining it, Yusuf et al found that the amount of tissue changes, fat deposition, and death of liver cells in diabetic rats with HFD/STZ was higher than that in the control group, and this amount decreased in groups treated with H2S (35). The findings also revealed that H2S could reduce liver injury. Assessment of the livers of the treated diabetic rats with low and high doses of H2S showed improvements in the structure, inflammation, fat deposition, and liver fibrosis.
Limitations
The present study had some limitations. Long-term H2S intervention can have better effects on OS and biochemical parameters. In addition, there were no molecular investigations or heart histological observations in this research.
Conclusion
Our results confirmed that H2S has potential hypoglycemic ability and has a significant effect on weight, FBS, insulin, insulin resistance, and lipid profile. It also improved the heart and liver enzymes and OS factors. After further investigation, H2S can be used as a strategy to prevent the complications of T2DM.
Acknowledgements
This study was financially supported by Kashan University of Medical Sciences (No. 98177). The results presented in this article were obtained from an MSc thesis submitted by H. Abutalebian.
Authors’ Contribution
Conceptualization: Nejat Kheiripour.
Data curation: Hadis Abutalebian, Mohammad Esmaeil Shahaboddin.
Formal analysis: Gholamreza Ghavipanjeh, Mojtaba Sehhat.
Funding acquisition: Nejat Kheiripour.
Investigation: Hadis Abutalebian, Azam Ghaseminezhad.
Methodology: Hadis Abutalebian, Mohammad Esmaeil Shahaboddin, Maryam Akhavan Taheri.
Project administration: Nejat Kheiripour.
Resources: Mohammad Esmaeil Shahaboddin, Nejat Kheiripour.
Software: Gholamreza Ghavipanjeh, Mojtaba Sehhat.
Supervision: Mohammad Esmaeil Shahaboddin, Nejat Kheiripour.
Validation: Nejat Kheiripour.
Visualization: Nejat Kheiripour.
Writing–original draft: Hadis Abutalebian, Mohammad Esmaeil Shahaboddin, Nejat Kheiripour.
Writing–review & editing: Nejat Kheiripour.
Competing Interests
The authors declared no conflict of interests.
Ethical Approval
The present study was approved by the Medical Ethics Committee of the Kashan University of Medical Sciences (IR.KAUMS.MEDNT.REC.1398.110).
Funding
This study was conducted as a MSc. thesis with the generous support of Kashan University of Medical Sciences (project number 98177).
References
- Bolbol Haghighi N, Molzemi S, Goli S, Mohammad Sadeghi H, Aminian M. The effect of hydroalcoholic extract of Ziziphoraclinopodioides lam on testicular damage caused by diabetes mellitus in male rats. J Babol Univ Med Sci 2017; 19(12):43-9. doi: 10.18869/acadpub.jbums.19.12.43.[Persian] [Crossref] [ Google Scholar]
- Kheiripour N, Karimi J, Tayebinia H, Khodaddi I, Goudarzi M. The effect of silymarin on the expression of urotensin–II and urotensin–II receptor genes in the liver tissue of type 2 diabetic rats. J Babol Univ Med Sci 2019; 21(1):27-33. doi: 10.22088/jbums.21.1.27.[Persian] [Crossref] [ Google Scholar]
- Rahimi R, Karimi J, Khodadadi I, Tayebinia H, Kheiripour N, Hashemnia M. Silymarin ameliorates expression of urotensin II (U-II) and its receptor (UTR) and attenuates toxic oxidative stress in the heart of rats with type 2 diabetes. Biomed Pharmacother 2018; 101:244-50. doi: 10.1016/j.biopha.2018.02.075 [Crossref] [ Google Scholar]
- Shen Y, Shen Z, Luo S, Guo W, Zhu YZ. The cardioprotective effects of hydrogen sulfide in heart diseases: from molecular mechanisms to therapeutic potential. Oxid Med Cell Longev 2015; 2015:925167. doi: 10.1155/2015/925167 [Crossref] [ Google Scholar]
- Pan LL, Qin M, Liu XH, Zhu YZ. The role of hydrogen sulfide on cardiovascular homeostasis: an overview with update on immunomodulation. Front Pharmacol 2017; 8:686. doi: 10.3389/fphar.2017.00686 [Crossref] [ Google Scholar]
- Piragine E, Calderone V. Pharmacological modulation of the hydrogen sulfide (H2S) system by dietary H2S-donors: a novel promising strategy in the prevention and treatment of type 2 diabetes mellitus. Phytother Res 2021; 35(4):1817-46. doi: 10.1002/ptr.6923 [Crossref] [ Google Scholar]
- Guo XX, Wang Y, Wang K, Ji BP, Zhou F. Stability of a type 2 diabetes rat model induced by high-fat diet feeding with low-dose streptozotocin injection. J Zhejiang Univ Sci B 2018; 19(7):559-69. doi: 10.1631/jzus.B1700254 [Crossref] [ Google Scholar]
- Yang F, Zhang L, Gao Z, Sun X, Yu M, Dong S. Exogenous H2S protects against diabetic cardiomyopathy by activating autophagy via the AMPK/mTOR pathway. Cell Physiol Biochem 2017; 43(3):1168-87. doi: 10.1159/000481758 [Crossref] [ Google Scholar]
- Sotoudeh N, Namavar MR. Optimisation of ketamine-xylazine anaesthetic dose and its association with changes in the dendritic spine of CA1 hippocampus in the young and old male and female Wistar rats. Vet Med Sci 2022; 8(6):2545-52. doi: 10.1002/vms3.936 [Crossref] [ Google Scholar]
- Cui H, Lin Y, Xie L, Zhao J. Urantide decreases hepatic steatosis in rats with experimental atherosclerosis via the MAPK/Erk/JNK pathway. Mol Med Rep 2021; 23(4):284. doi: 10.3892/mmr.2021.11923 [Crossref] [ Google Scholar]
- Brunt EM. Grading and staging the histopathological lesions of chronic hepatitis: the Knodell histology activity index and beyond. Hepatology 2000; 31(1):241-6. doi: 10.1002/hep.510310136 [Crossref] [ Google Scholar]
- Bahadoran Z, Jeddi S, Mirmiran P, Kashfi K, Azizi F, Ghasemi A. Association between serum hydrogen sulfide concentrations and dysglycemia: a population-based study. BMC Endocr Disord 2022; 22(1):79. doi: 10.1186/s12902-022-00995-8 [Crossref] [ Google Scholar]
- Suzuki K, Sagara M, Aoki C, Tanaka S, Aso Y. Clinical implication of plasma hydrogen sulfide levels in Japanese patients with type 2 diabetes. Intern Med 2017; 56(1):17-21. doi: 10.2169/internalmedicine.56.7403 [Crossref] [ Google Scholar]
- Dutta M, Biswas UK, Chakraborty R, Banerjee P, Raychaudhuri U, Kumar A. Evaluation of plasma H2S levels and H2S synthesis in streptozotocin induced type-2 diabetes-an experimental study based on Swietenia macrophylla seeds. Asian Pac J Trop Biomed 2014; 4(Suppl 1):S483-7. doi: 10.12980/apjtb.4.201414b58 [Crossref] [ Google Scholar]
- Cai J, Shi X, Wang H, Fan J, Feng Y, Lin X. Cystathionine γ lyase-hydrogen sulfide increases peroxisome proliferator-activated receptor γ activity by sulfhydration at C139 site thereby promoting glucose uptake and lipid storage in adipocytes. Biochim Biophys Acta 2016; 1861(5):419-29. doi: 10.1016/j.bbalip.2016.03.001 [Crossref] [ Google Scholar]
- Yang G, Ju Y, Fu M, Zhang Y, Pei Y, Racine M. Cystathionine gamma-lyase/hydrogen sulfide system is essential for adipogenesis and fat mass accumulation in mice. Biochim Biophys Acta Mol Cell Biol Lipids 2018; 1863(2):165-76. doi: 10.1016/j.bbalip.2017.11.008 [Crossref] [ Google Scholar]
- Szkudelski T. Szkudelski TStreptozotocin-nicotinamide-induced diabetes in the ratCharacteristics of the experimental model. Exp Biol Med (Maywood) 2012; 237(5):481-90. doi: 10.1258/ebm.2012.011372 [Crossref] [ Google Scholar]
- Goyal SN, Reddy NM, Patil KR, Nakhate KT, Ojha S, Patil CR. Challenges and issues with streptozotocin-induced diabetes - a clinically relevant animal model to understand the diabetes pathogenesis and evaluate therapeutics. Chem Biol Interact 2016; 244:49-63. doi: 10.1016/j.cbi.2015.11.032 [Crossref] [ Google Scholar]
- Comas F, Moreno-Navarrete JM. The impact of H2S on obesity-associated metabolic disturbances. Antioxidants (Basel) 2021; 10(5):633. doi: 10.3390/antiox10050633 [Crossref] [ Google Scholar]
- Kaneko Y, Kimura T, Taniguchi S, Souma M, Kojima Y, Kimura Y. Glucose-induced production of hydrogen sulfide may protect the pancreatic beta-cells from apoptotic cell death by high glucose. FEBS Lett 2009; 583(2):377-82. doi: 10.1016/j.febslet.2008.12.026 [Crossref] [ Google Scholar]
- Bitar MS, Nader J, Al-Ali W, Al Madhoun A, Arefanian H, Al-Mulla F. Hydrogen sulfide donor NaHS improves metabolism and reduces muscle atrophy in type 2 diabetes: implication for understanding sarcopenic pathophysiology. Oxid Med Cell Longev 2018; 2018:6825452. doi: 10.1155/2018/6825452 [Crossref] [ Google Scholar]
- Kema VH, Khan I, Jamal R, Vishwakarma SK, Lakki Reddy C, Parwani K. Protective effects of diallyl sulfide against ethanol-induced injury in rat adipose tissue and primary human adipocytes. Alcohol Clin Exp Res 2017; 41(6):1078-92. doi: 10.1111/acer.13398 [Crossref] [ Google Scholar]
- Jeddi S, Gheibi S, Carlström M, Kashfi K, Ghasemi A. Long-term co-administration of sodium nitrite and sodium hydrosulfide inhibits hepatic gluconeogenesis in male type 2 diabetic rats: Role of PI3K-Akt-eNOS pathway. Life Sci 2021; 265:118770. doi: 10.1016/j.lfs.2020.118770 [Crossref] [ Google Scholar]
- Gheibi S, Jeddi S, Carlström M, Kashfi K, Ghasemi A. Hydrogen sulfide potentiates the favorable metabolic effects of inorganic nitrite in type 2 diabetic rats. Nitric Oxide 2019; 92:60-72. doi: 10.1016/j.niox.2019.08.006 [Crossref] [ Google Scholar]
- Mohammed RA, Shawky HM, Rashed LA, Elhanbuli HM, Abdelhafez DN, Said ES. Combined effect of hydrogen sulfide and mesenchymal stem cells on mitigating liver fibrosis induced by bile duct ligation: role of anti-inflammatory, anti-oxidant, anti-apoptotic, and anti-fibrotic biomarkers. Iran J Basic Med Sci 2021; 24(12):1753-62. doi: 10.22038/ijbms.2021.56477.12604 [Crossref] [ Google Scholar]
- Peake BF, Nicholson CK, Lambert JP, Hood RL, Amin H, Amin S. Hydrogen sulfide preconditions the db/db diabetic mouse heart against ischemia-reperfusion injury by activating Nrf2 signaling in an Erk-dependent manner. Am J Physiol Heart Circ Physiol 2013; 304(9):H1215-24. doi: 10.1152/ajpheart.00796.2012 [Crossref] [ Google Scholar]
- Liu X, Yang R, Bai W, Xu X, Bi F, Hao Y. Involvement of amylin B-H2S-connexin 43 signaling pathway in vascular dysfunction and enhanced ischemia-reperfusion-induced myocardial injury in diabetic rats. Biosci Rep 2020; 40(6):BSR20194154. doi: 10.1042/bsr20194154 [Crossref] [ Google Scholar]
- Ansari M, Kurian GA. Mechanism of hydrogen sulfide preconditioning-associated protection against ischemia-reperfusion injury differs in diabetic heart that develops myopathy. Cardiovasc Toxicol 2020; 20(2):155-67. doi: 10.1007/s12012-019-09542-9 [Crossref] [ Google Scholar]
- Baig MA, Panchal SS. Streptozotocin-induced diabetes mellitus in neonatal rats: an insight into its applications to induce diabetic complications. Curr Diabetes Rev 2019; 16(1):26-39. doi: 10.2174/1573399815666190411115829 [Crossref] [ Google Scholar]
- Zhou X, An G, Lu X. Hydrogen sulfide attenuates the development of diabetic cardiomyopathy. Clin Sci (Lond) 2015; 128(5):325-35. doi: 10.1042/cs20140460 [Crossref] [ Google Scholar]
- Liu M, Li Y, Liang B, Li Z, Jiang Z, Chu C. Hydrogen sulfide attenuates myocardial fibrosis in diabetic rats through the JAK/STAT signaling pathway. Int J Mol Med 2018; 41(4):1867-76. doi: 10.3892/ijmm.2018.3419 [Crossref] [ Google Scholar]
- Olas B, Wachowicz B. Role of reactive nitrogen species in blood platelet functions. Platelets 2007; 18(8):555-65. doi: 10.1080/09537100701504087 [Crossref] [ Google Scholar]
- Veldt BJ, Chen W, Heathcote EJ, Wedemeyer H, Reichen J, Hofmann WP. Increased risk of hepatocellular carcinoma among patients with hepatitis C cirrhosis and diabetes mellitus. Hepatology 2008; 47(6):1856-62. doi: 10.1002/hep.22251 [Crossref] [ Google Scholar]
- Rajapaksha IG, Gunarathne LS, Asadi K, Laybutt R, Andrikopoulous S, Alexander IE. Angiotensin converting enzyme-2 therapy improves liver fibrosis and glycemic control in diabetic mice with fatty liver. Hepatol Commun 2022; 6(5):1056-72. doi: 10.1002/hep4.1884 [Crossref] [ Google Scholar]
- Yusuf M, Kwong Huat BT, Hsu A, Whiteman M, Bhatia M, Moore PK. Streptozotocin-induced diabetes in the rat is associated with enhanced tissue hydrogen sulfide biosynthesis. Biochem Biophys Res Commun 2005; 333(4):1146-52. doi: 10.1016/j.bbrc.2005.06.021 [Crossref] [ Google Scholar]