Avicenna Journal of Medical Biochemistry. 10(1):20-29.
doi: 10.34172/ajmb.2022.03
Original Article
Synergistic Effect of Cloves (Syzygium aromaticum), Thyme (Thymus vulgaris) and Lemon (Citrus limon) Blended Essential Oils Optimized by Mixture Design for Improving the Antioxidant Activity
Walid Yeddes 1, 2, Islem Mejri 1, Taycir Grati-Affes 1, Saber Khammassi 1, Majdi Hammami 1, Wissem Aidi-Wannes 1, *  , Moufida Saidani-Tounsi 1
Author information:
1Laboratory of Aromatic and Medicinal Plants, Borj Cedria Biotechnology Center, BP901, 2050 Hammam-Lif, Tunisia
2Faculty of Science of Bizerte, University of Carthage, Jarzouna7021, Tunisia
*
Corresponding author: Wissem Aidi Wannes, Laboratory of Aromatic and Medicinal Plants, Biotechnology Center in Borj-Cedria Technopol, BP. 901, 2050 Hammam-Lif, Tunisia. Tel: +21679325738, Fax: +21679412638; Email:
aidiwissem@yahoo.fr
Abstract
Background: Combining various essential oils (EOs) for developing pharmaceutical formulations has been the focus of attention in recent years.
Objectives: This study aimed to determine the antioxidant effect of the combination of three Eos obtained from clove (Syzygium aromaticum L.), lemon peel (Citrus limon L.), and thyme (Thymus vulgaris L.) by using mixture design.
Methods: The EOs of lemon peel (EOL), clove (EOC), and thyme (EOT) as well as their combination were analyzed using a gas chromatograph with flame ionization detector (GC/FID). The antioxidant activities of the EOs from EOL, EOC, and EOT as well as their combination were measured adopting DPPH assay. The construction and statistical analysis of the experiment were designed using the NemrodW (LPRAI, version 2000) software.
Results: EOL, EOC, and EOT were found capable of neutralizing DPPH radical. EOC was distinguished by its strongest antiradical activity with IC50=15.02±0.02 µg/mL. EOT had an IC50=29.20±0.12 µg/mL while EOL had 188.69±0.95 µg/mL. The positive standard BHT was detected to be IC50=24±0.02 µg/ mL. The optimal, combinative mixture of essential oils may have been determined based on these isoresponse curves which allowed fixing the ideal combinations of ingredient in terms of quantity to obtain an EO mixture possessing appreciable and optimal antioxidant characteristics. The predicted antioxidant properties determined by the mixing plan model were retained and the experiments were carried out respecting the contents of proposed ingredients of 25.7% EOT, 32.3% EOL, and 41.9% EOC equivalent to 15.42 mg, 19.38 mg and 25.14 mg, respectively. This resulted in arriving at an essential oil mixture with an experimental IC50=11.023±0.145 µg/mL which was similar to those of the predicted antioxidant properties with an order of 10.907±0.212 µg/mL and a non-significant difference of P<0.05, based on which the validity of the proposed mixing plan model was determined. The combined EO was also found to be rich in eugenol (32.35±1.13%), thymol (25.49±0.03%), and limonene (21.30±0.02%).
Conclusion: Statistical planning and the development of utility profiles for mixtures of essential oils may have been used to predict the optimal composition as well as to determine their antioxidant profile.
Keywords: Clove (Syzygium aromaticum L.), Lemon peel (Citrus limon L.), Thyme (Thymus vulgaris L.), Essential oil, Antioxidant activity, Mixture design,
Copyright and License Information
© 2022 The Author(s); Published by Hamadan University of Medical Sciences.
This is an open-access article distributed under the terms of the Creative Commons Attribution License (
http://creativecommons.org/licenses/by/4.0), which permits unrestricted use, distribution, and reproduction in any medium provided the original work is properly cited.
Please cite this article as follows: Yeddes W, Mejri I, Grati-Affes T, Khammassi S, Hammami M, Aidi-Wannes W, et al. Synergistic effect of cloves (syzygium aromaticum), thyme (thymus vulgaris) and lemon (citrus limon) blended essential oils optimized by mixture design for improving the antioxidant activity. Avicenna J Med Biochem. 2022; 10(1): 20-29. doi:10.34172/ajmb.2022.03
Background
Oxidative stress occurs naturally as an outcome of aerobic cellular metabolism (1). The free radicals exert harmful effects on human body due to their unstable complexes responsible for DNA mutations, lipid oxidation, and peroxidation of proteins. All these processes appear to enormously contribute to several disorders including cardiovascular and neurodegenerative diseases (2). Since developing a new effective strategy for protecting human health from free radical damage has been the focus of attention in recent years, natural products obtained from plant species have attracted considerable research attention (3). Among these various kinds of natural substances, plant-derived essential oils (EOs) have been historically confirmed to be valuable sources of bioactive molecules which could be exploited as bio-products for industrial purposes (e.g., pharmaceutical and food industries) (4).
EOs have been used not only in monotherapy but in combinations for many years. The interaction between EO compounds can produce four possible effects, namely indifferent, additive, antagonistic, or synergistic effects (5). Generally, the antagonistic effect is attributed to the interaction between non-oxygenated and oxygenated monoterpene hydrocarbons (6). The additive and synergism effects are associated with phenolic and alcohol compounds (7). Therefore, the compounds with similar structures exhibit additive rather than synergistic effect. The possible synergistic effect produced by the combination of plant EOs has been determined to be an efficient strategy to inhibit or reduce the natural oxidation process of foods. In light of these considerations, three local aromatic and medicinal plant species, namely clove (Syzygium aromaticum), lemon peel (Citrus limon), and thyme (Thymus vulgaris) were selected for synergistic combination screening of their EOs after considering their popular use in traditional medicine. Since there was no study investigating the combination of their EOs in the literature, this study aimed to determine the antioxidant effect of the combination of three EOs obtained from clove, lemon peel, and thyme using mixture design.
Materials and Methods
Plant Materiel
In this study, three aromatic and medicinal plants including cloves (Syzygium aromaticum), thyme (Thymus vulgaris L.), and citrus (Citrus limon L.) were examined. Tunisian cloves were purchased from the local market in the form of dried flower buds and then were stored in a dry, tightly closed bottle. Thyme was collected in March from the mountain of Bou Garnine and was transferred to a laboratory where it was dried at room temperature before being subjected to the extraction of EO. Lemon peel was obtained from the lemon tree (four seasons due to its great floridity) variety ‘Eureka’.Voucher specimens were deposited in the herbarium of our laboratory (Syzygium aromaticum Sa-LPAM-2021; Citrus limon Cl-LPAM-2021; Thymus vulgaris Tv-LPAM-2021).
Essential Oil Extraction Techniques
Essential Oils Extraction From Thyme Leaf and Lemon Peel by Clevenger
The apparatus used for performing hydro distillation was of the Clevenger type. It consisted of a flask heater, a 2 L Pyrex glass flask where we placed 100 g of dried material, a vapor condensation column (refrigerant), and a collector in Pyrex glass which received the extracts from the distillation for 3 hours. The condensed vapor led to the EO which was separated from the hydrolate(aromatic waters) by performing decantation after adding magnesium sulfate (MgSO4) to remove traces of water. The EOs were collected directly by using a Pasteur pipette over the distillate without adding any solvent. The quantity of the obtained EO was weighed in order to calculate the yield and, then, was stored in opaque bottles at 4°C (8).
Extraction of Clove Essential Oil by Distillation
As for extraction, 500 g of cloves were soaked in 4 L of distilled water in a stainless steel still and, then, the still was heated under pressure to bring its contents to the boil for 3 hours. After the condensation, the EO was separated from the distillate by decantation after adding MgSO4 to remove traces of water. The quantity of EO obtained was weighed in order to calculate the yield, and then it was stored in opaque bottles at 4°C.
Characterization by Chromatographic Analysis of the Obtained Essential Oils
Identifying the Volatile Compounds by GC/MS
CPG/MS coupling makes it possible to identify volatile compounds. The principle behind this identification is based on the fragmentation of compounds to follow their bombardment by a flow of electrons as well as their exposure to electric fields. In our study, the released ions were classified according to their mass/charge ratio (m/z). The analysis was carried out by a chromatograph coupled to a quadrupole type mass spectrometer (HEWLET-PACKARD 5972 A) and equipped with a HP-5ms column and an oven temperature program (50°C to 240°C at a rate of 5°C/min).
GC-FID Quantification Method
The analysis was carried out by Hewlett-Packard 6890 chromatograph equipped with an electronic pressure control injector, a flame ionization detector, and a HP-INNOWax (polyethylene glycol capillary) column (30 m x 0.25 mm; 0.25 μm). The flow of the carrier gas (N2) was 1.6 mL/min, and the split ratio was 60:1. When conducting the analysis, the following temperature program was followed: oven temps isotherm at 35°C for 10 minutes, from 35 to 205°C at the rate of 2°C/min, and isotherm at 205°C for 10 minutes. Injector and detector temperatures were maintained at 250 and 300°C, respectively. The injection volume was 1 µL.
Identifying Volatile Compounds by GC/MS
The GC/MS coupling facilitated the identification of volatile compounds. The principle behind the identification was based on the fragmentation of compounds through their bombardment by a flow of electrons as well as their exposure to electric fields (9). The released ions were classified according to their mass/charge ratio (m/z). The analysis was carried out by employing a chromatograph coupled to an Agilent mass spectrometer (5975C inert XL MSD) and performing electron impact ionization (70 eV). An HP-5MS capillary column (30 m × 0.25 mm, 0.25 µm film thickness) coated with 5 % phenyl methyl silicone and 95% dimethylpolysiloxane was used. The oven temperature was programmed at 40°C for 1 minute, and then it was raised from 40 to 100°C at a rate of 8°C/min and kept constant at 100°C for 5 minutes. The temperature was increased to 200°C with a rate of 10°C/min and kept constant at 200°C for 3 minutes and, then, the final temperature was set up at 300°C with a rate of 2°C/min. Injector temperature was set at 250°C. The carrier gas was helium with a flow rate of 1 mL/min, and the split ratio was 100:1. Scan time and mass ranges were 1 second and 50-550 m/z, respectively. Individual peaks corresponding to the volatile components were identified by comparing their retention indices (RI) relative to (C8-C40) n-alkanes with those of literature or those of authentic compounds available in the authors’ laboratory. Further identification was made by matching their recorded mass spectra with those stored in the Wiley 09 NIST 2011 mass spectral library of the GC/MS data system.
Antioxidant Activity Assay
Following the method developed by Hatano et al (9), the anti-free radical activity was evaluated by the percentage inhibition of the degradation of the DPPH radical measured by spectrophotometry at 517 nm. A 250 μL aliquot of the solution DPPH was added to 1 mL of EO (sample) at different concentrations (5, 10, 15, 100 mg/mL). The variation in absorbance was measured after keeping the mixtures for 30 minutes at obscurity by referring to a reference without EO. The anti-free radical activity was estimated as a percentage inhibition using the following formula:
IP=(OD control – OD sample/ OD control) × 100
Where IP: percentage inhibition, OD control: reading of the control absorbance, OD sample: reading of the absorbance of the solution of the sample. The IC50 value was expressed in µg/mL. The lower value corresponded to the effectiveness of the higher antioxidant activity of the sample.
Optimization of the Antioxidant Activity of the Blended Essential Oil by Using Mixture Design Methodology
The studied optimal response, which was the antioxidant activity of the blended EO expressed in median inhibitory concentration IC50, was obtained by using NemrodW software (LPRAI, version 2000) in order to define the optimal blending condition made with three main ingredients. These were the EOs from three medicinal plants including clove (Syzygium aromaticum) from the flower (HEC), Lemon tree (Citrus limon L.) from the zest (HECL), and Common thyme (Thymus vulgaris L.) from the leaves (HET). The results obtained by software are presented in two graphs (i.e., mixing contour graph and 3-dimensional graph) of the optimum desirable response. The mixing plan design employed in this study was developed after referring to an earlier study by Crespo et al (10).
Studied Factors and Experimental Fields
Table 1 summarizes three ingredients of the matrix of mixing plan (i.e., EOT (X1), EOL (X2) and EOC (X3)), which was created using the NemrodW software (LPRAI 2000, France). Likewise, the studied factors as well as their experimental fields are shown in Table 1.
Table 1.
Studied Factors and Experimental Fields
|
|
Corposant
|
Constraint Inferior
|
Constraint Superior
|
| X1 |
EOT |
0.0000 |
1.0000 |
| X2 |
EOL |
0.0000 |
1.0000 |
| X3 |
EOC |
0.0000 |
1.0000 |
|
|
Total |
1.0000 |
|
Experimental Matrix for the Design of Mixtures
The experimental matrix was prepared by making 10 blends of the following ingredients in different amounts (μg/mL): EOT (X1), EOL (X2) and EOC (X3). The various blends obtained were subjected to a test to assess the DPPH antioxidant activity (Table 2).
Table 2.
Experimental Matrix of Mixture Design
|
N° Exp
|
EOT
(X1)
|
EOL
(X2)
|
EOC
(X3)
|
DPPH IC50
(Y1) µg/mL
|
| 1 |
1.0000 |
0.0000 |
0.0000 |
29.200 |
| 2 |
0.0000 |
1.0000 |
0.0000 |
188.690 |
| 3 |
0.0000 |
0.0000 |
1.0000 |
15.020 |
| 4 |
0.0000 |
0.5000 |
0.5000 |
120.250 |
| 5 |
0.5000 |
0.0000 |
0.5000 |
12.355 |
| 6 |
0.5000 |
0.5000 |
0.0000 |
80.560 |
| 7 |
0.6667 |
0.1667 |
0.1667 |
60.658 |
| 8 |
0.1667 |
0.6667 |
0.1667 |
94.655 |
| 9 |
0.1667 |
0.1667 |
0.6667 |
18.960 |
| 10 |
0.3333 |
0.3333 |
0.3333 |
40.236 |
Statistical Analysis
The results reported in this study are mean values of at least three repetitions (n = 3) unless otherwise stated. Pearson correlation and principal component analysis (PCA) was calculated by XLStat. Pro® Version 2014.5.03 statistical software (XLStat, Paris, France) was used to analyze the data, and significance level was set at P < 0.05%. The construction and the statistical analysis of the experimental were design using the NemrodW (LPRAI, version 2000) software.
Results
Optimization of Antioxidant Activity by Mixture Design
The antioxidant activities of the EOs from lemon peel (EOL), clove (EOC), and thyme (EOT) were measured using DPPH assay. The results showed that EOL, EOC, and EOT had the potential to neutralize DPPH radical. EOC was distinguished by its strongest antiradical activity with IC50 = 15.02 ± 0.02 µg/mL. EOT had an IC50 = 29.20 ± 0.12 µg/mL while EOL had 188.69 ± 0.95µg/mL. The positive standard BHT showed an IC50 = 24 ± 0.02 µg/mL. The desirable optimal response was elucidated by two curves, one by the contours of the mixture (2D) and another one by 3D obtained based on the interaction between three ingredients including EOT (X1), EOL (X2), and EOC (X3), respectively (Figure 1). As for each response, the predicted and experimental results were investigated to confirm the optimal results proposed by the mixture design. Figure 1A and 1B represent the iso-response curves of the optimal antioxidant responses in terms of the median inhibitory concentration (IC50) of free radical’s DPPH. The optimal mixture of the EO combination may have been determined through these iso-response curves which allowed fixing the ideal combinations of ingredient (EOT (X1), EOL (X2) and EOC (X3)) in terms of quantity to obtain an EO mixture with appreciable and optimal antioxidant characteristics.
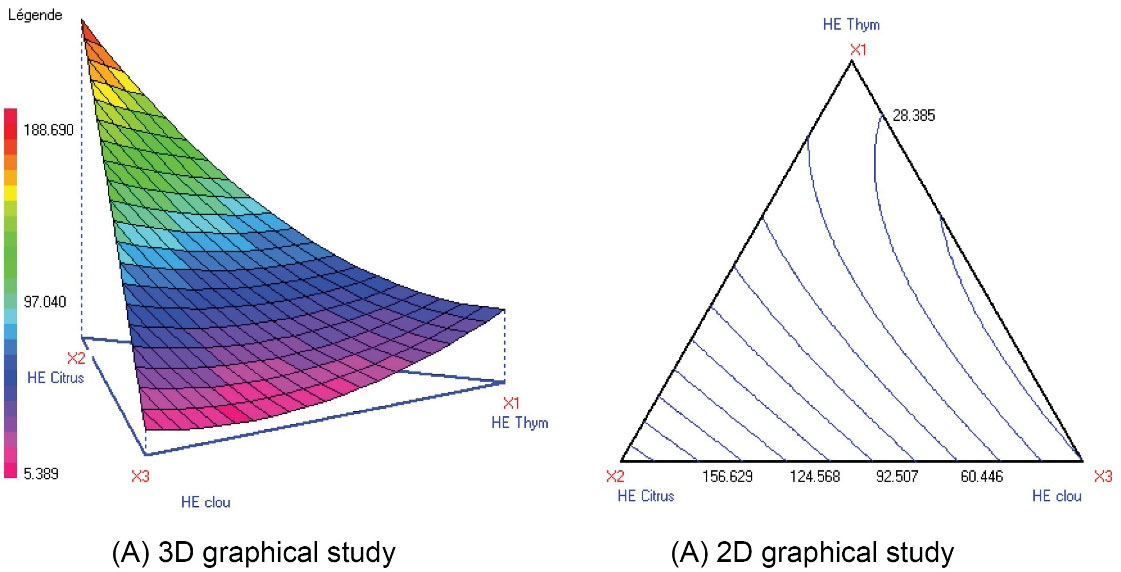
Figure 1.
Iso-response Variation of YDPPH IC50 in the Mixture Design (X1: EOT, X2: EOL, X3: EOC).
.
Iso-response Variation of YDPPH IC50 in the Mixture Design (X1: EOT, X2: EOL, X3: EOC).
Meaning the Factors for the Response Y (IC50: DPPH)
The significance coefficients of the factors involved for the response Y: (IC50: DPPH), are shown in Table 3. The results showed that certain ingredients such as the EO of citrus Lemon (HEC (X2)) (b2) may have significantly influenced the antioxidant activity of the obtained EO mixture with significance of P value < 1% (level of significance 99%). In fact, the addition of lemon EO was capable of influencing the antioxidant activity negatively by increasing the value of IC50. For the same response (Y: (IC50: DPPH)), the other ingredients (EOT (X1) and EOC (X3)) were found to be insignificant with percentage order of 13.8% and 60.0%, which showed a considerable decrease in IC50 and, consequently, a considerable increase in the antioxidant activity of EO mixture (Table 3). These results indicated that the interactions among the ingredients may have contributed to the antioxidant properties of EO mixture.
Table 3.
Factor Significance of Y (IC50: DPPH)
|
Nom
|
Coefficient
|
F. Inflation
|
Ecart-Type
|
t.exp.
|
Signif. %
|
| Y: (IC50: DPPH) |
| b1 |
40.43 |
1.96 |
21.96 |
1.84 |
13.8% |
| b2 |
184.89 |
1.96 |
21.96 |
8.42 |
** |
| b3 |
12.56 |
1.96 |
21.96 |
0.57 |
60.0% |
| b12 |
-151.21 |
1.98 |
101.22 |
-1.49 |
20.9% |
| b13 |
-74.00 |
1.98 |
101.22 |
-0.73 |
50.9% |
| b23 |
8.50 |
1.98 |
101.22 |
0.08 |
93.5% |
**represents the significance at P value < 1%. Y (IC50 ; DPPH): resistance at transaction (Y1). b1: coefficient of X1 factor (EOT); b2: coefficient of X2 factor (EOL); b3: coefficient of X3 factor (EOL)
Predicted and Experimental Values of Responses Under Optimal Conditions
Analysing the results in Table 4 regarding the residues of the Y response (IC50: DPPH), it was found that the predicted antioxidant properties proposed by the mixing plan model were retained and the experiments were carried out respecting the contents of ‘proposed ingredients of 25.7% EOT (X1), 32.3% EOL (X2), and 41.9% EOC (X3) equivalent to 15.42 mg, 19.38 mg and 25.14 mg, respectively, per 50 g of microcapsule powder.
Table 4.
Response Residues of Y (IC50: DPPH)
|
Number
|
Yexp.
|
Ycalc.
|
Difference
|
Nome
|
SE
|
Student-R
|
R-Student
|
D-Cook
|
| 1 |
29.2000 |
40.4395 |
-11.2395 |
-0.494 |
0.930 |
-1.8675 |
-4.5192 |
7.7420 |
| 2 |
188.6900 |
184.8949 |
3.7951 |
0.167 |
0.930 |
0.6306 |
0.5755 |
0.8827 |
| 3 |
15.0200 |
12.5690 |
2.4510 |
0.108 |
0.930 |
0.4073 |
0.3602 |
0.3682 |
| 4 |
120.2500 |
100.8593 |
19.3907 |
0.851 |
0.736 |
1.6561 |
2.5580 |
1.2720 |
| 5 |
12.3550 |
8.0033 |
4.3517 |
0.191 |
0.736 |
0.3717 |
0.3276 |
0.0641 |
| 6 |
80.5600 |
74.8639 |
5.6961 |
0.250 |
0.736 |
0.4865 |
0.4343 |
0.1098 |
| 7 |
60.6580 |
35.0843 |
25.5737 |
1.123 |
0.251 |
1.2975 |
1.4765 |
0.0940 |
| 8 |
94.6550 |
114.1895 |
-19.5345 |
-0.858 |
0.251 |
-0.9911 |
-0.9881 |
0.0548 |
| 9 |
18.9600 |
34.4620 |
-15.5020 |
-0.681 |
0.251 |
-0.7865 |
-0.7408 |
0.0345 |
| 10 |
40.2365 |
55.2194 |
-14.9829 |
-0.658 |
0.250 |
-0.7596 |
-0.7111 |
0.0320 |
Yexp.: Y experimental; Ycalc.: Y calculated; SE, standard error
This facilitated arriving at an EO mixture with experimental IC50 values of the order of 11.023 ± 0.145 µg/mL which were similar to those of the predicted antioxidant properties which were of the order of 10.907 ± 0.212 µg/mL, with a non-significant difference of P < 0.05, based on which it was found that the proposed mixing plan model was valid (Table 5). The optimization procedure by using the mixing plan resulted in a considerable improvement in the antioxidant activity of the EO samples (IC50 = 11.023 ± 0.145 µg/mL) formulated based on a combination of clove, thyme, and lemon peel EOs.
Table 5.
Optimization of Antioxidant Activity of the Essential Oil Mixture
|
|
Ingredient Proportion (g) Proposed by the Mixture Design
|
Predicted Antioxidant Activity (µg/mL)
|
Experimental Antioxidant Activity (µg/mL)
|
| EOT (X1) |
25.7%eq (15.42 mg) |
10.907 ± 0.212 |
11.023 ± 0.145 |
| EOL (X2) |
32.3%eq (19.38 mg) |
| EOC (X3) |
41.9%eq (25.14 mg) |
Moreover, Table 6 shows that the “ratio-F” regression which was the ratio between the mean square of the regression and the residue for the response Y were greater than the tabulated value: Freg Y (5.4, 0.05) = 10.2927 > 6.26) with a probability less than 5%, which confirmed that the coefficients of the factors of the postulated model were significant. What consolidated the previous result was the fact that the postulated model was valid (Table 6).
Table 6.
Variance Analysis of the Optimal Y(DPPH, IC50)
|
Variation
|
Total
|
Liberty Grade
|
Mean
|
(Ratio F)
|
P
|
| Regression |
2.66905E+0004 |
5 |
5.33810E+0003 |
10.2927 |
*
|
| Residues |
2.07453E+0003 |
4 |
5.18632E+0002 |
|
|
| Total |
2.87650E+0004 |
9 |
|
|
|
*statistically significant at P value < 0.05
Therefore, the antioxidant property model (DPPH) of the optimized blended EO proposed by the mixture design was written as follows:
Y(DPPH, IC50)= 40.43 X1 + 184.89 X2 + 12.56 X3 – 151.21 (X1*X2) -74.00 (X1*X3) + 8.50 (X2*X3)
Finally, EO mixture was obtained and considered to be an excellent additive with an optimized antioxidant property. Taking into account the statistical examination, moreover, it was detected that the content of the EO from EOL (X2)) (b2) may have influenced the antioxidant activity (Y: (IC50: DPPH)).
Evaluating Antioxidant Activity of the Essential Oil Blend Optimized by Mixture Design Methodology
Taking into account the results of the antioxidant activity through evaluating the median inhibition concentration of free radical’s DPPH, the EO mixture obtained from clove, lemon peel, and thyme showed a considerable antioxidant activity (IC50 = 11.023 ± 0.145 µg/mL) compared to those of BHT (positive standard), EOC, EOT, and EOL characterized by IC50 of 24 ± 0.11 µg/mL, 15.02 ± 0.02 µg/mL, 29.2 ± 0.12 µg/mL, and 188.69 ± 0.95 µg/mL, respectively (Figure 2).
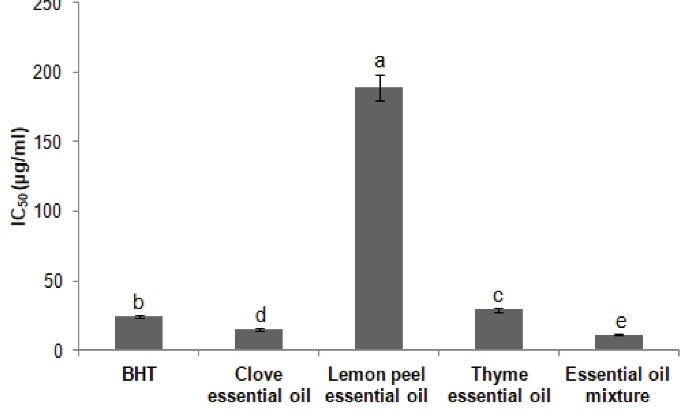
Figure 2.
Antioxidant Activity of Clove, Lemon Peel and Thyme Essential Oils and Their Combination. IC50 values with different letters (a,b,c,d,e) are significantly different at P < 0.05.
.
Antioxidant Activity of Clove, Lemon Peel and Thyme Essential Oils and Their Combination. IC50 values with different letters (a,b,c,d,e) are significantly different at P < 0.05.
Study of the Chemical Composition of Essential Oils and the Synergistic Effect Between Volatile Compounds on the Variation of Antioxidant Activity
The yields of lemon peel, clove, and thyme EOs were determined to be 1.30 ± 0.78, 5.11 ± 0.99 and 1.25 ± 0.57%, respectively, based on dry weight of plant material. GC-MS analysis of lemon peel, clove, and thyme EOs as well as their combination are given in Figure 3. Twenty-one volatile compounds were identified in lemon peel composing 99.07 ± 0.83% of EO, eight compounds in clove encompassing 99.92 ± 0.78% of EO, and sixteen compounds in thyme covering 99.99 ± 0.71% of EO. For the combination, 26 compounds were identified having 99.27 ± 0.11% of EO. Lemon peel EO was characterized by the predominance of limonene (71.81 ± 0.78%). Eugenol (87.3 ± 3.70%) was the main component in clove EO, and thymol (78.54 ± 4.50%) was the major one in thyme EO. In other words, the combined EO was mainly rich in eugenol (32.35 ± 1.13%), thymol (25.49 ± 0.03%), and limonene (21.30 ± 0.02%).
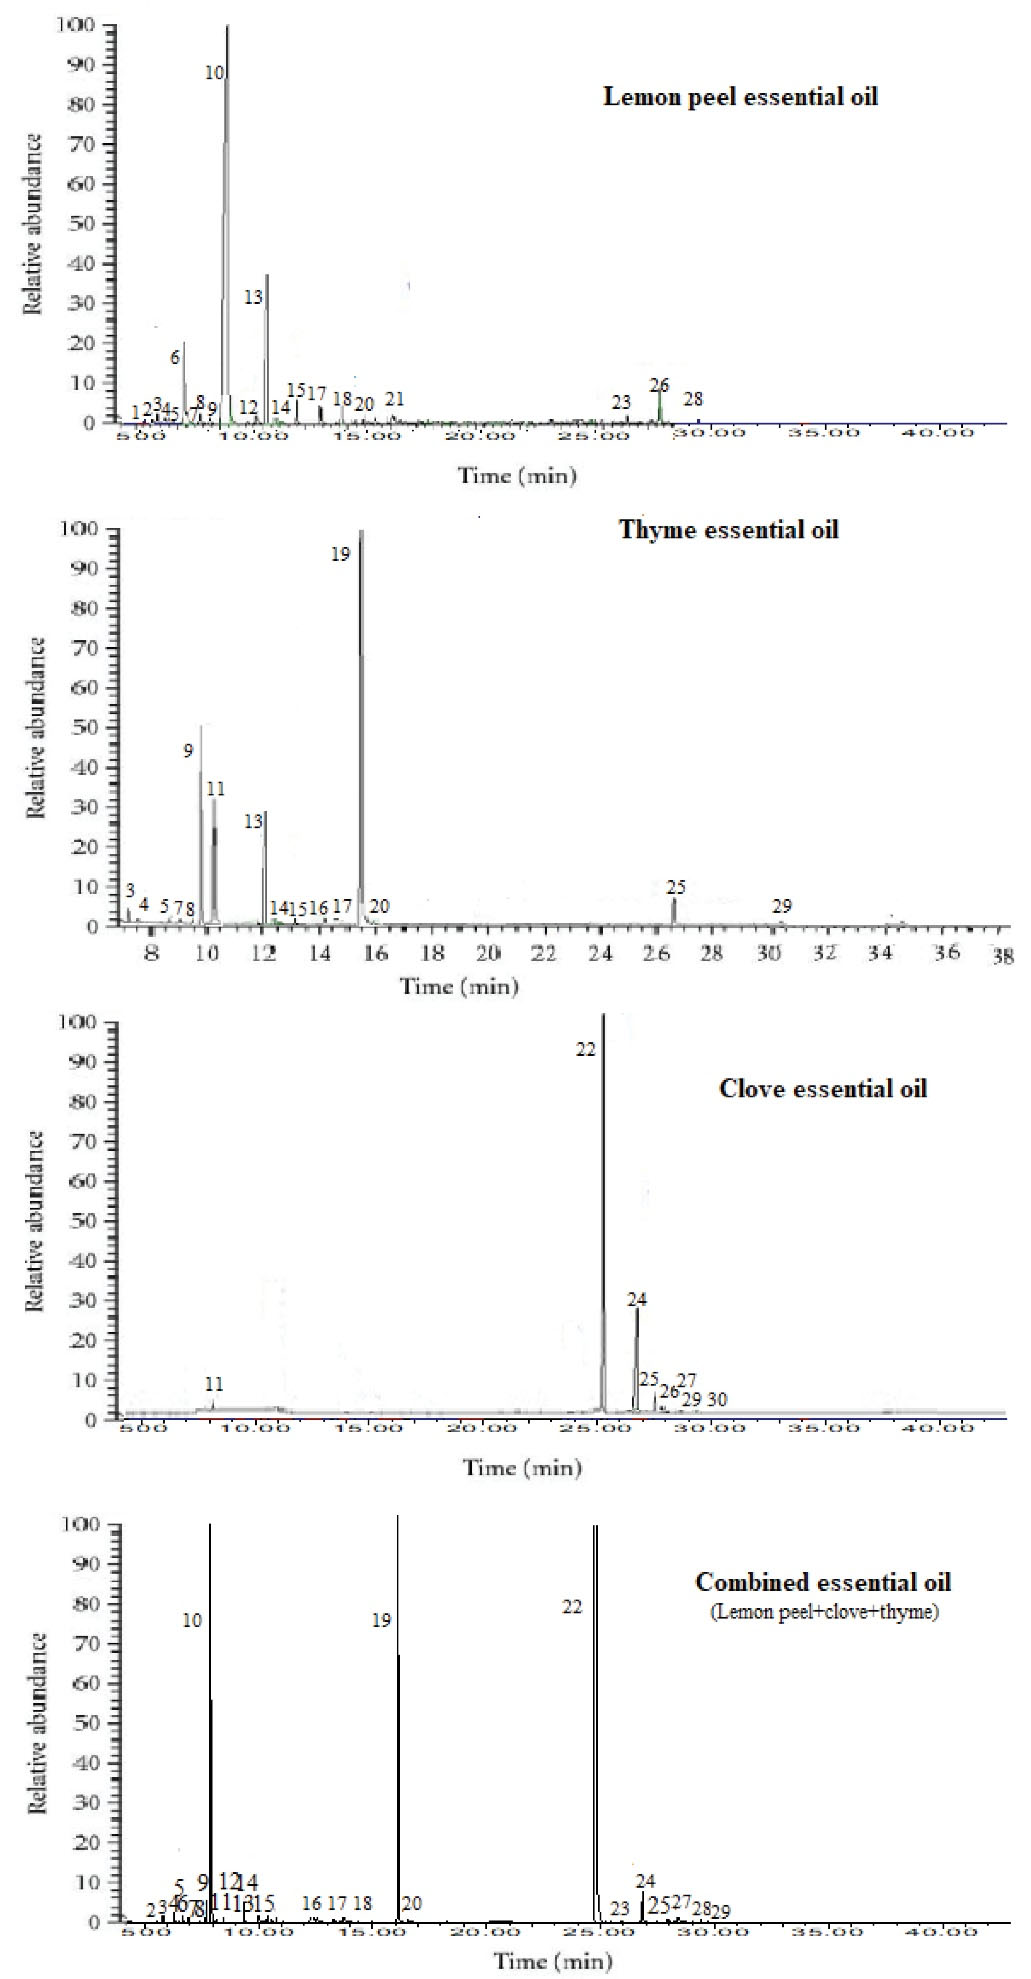
Figure 3.
Gas Chromatography Chromatograms of Lemon Peel, Thyme and Clove Essential Oils and Their Combination. 1: Tricyclene; 2: α-Thujene; 3: α-Pinene; 4: β-Pinene; 5: Camphene; 6: Sabinene; 7: β-Myrcene; 8: α-Terpinene; 9: p-Cymene; 10: limonene; 11: 1,8-Cineole; 12: E-β-Ocimene; 13: γ-terpinene; 14: linalool; 15: Borneol; 16: Terpinene-4-ol; 17: α-Terpineol; 18: Camphor; 19: Thymol; 20: Carvacrol; 21: Bornyl acetate; 22: Eugenol; 23: geranyl acetate; 24: eugenol acetate; 25: E-Caryophyllene; 26: Germacrene-D; 27: α-Humulene; 28: Valencene; 29: Caryophyllene oxide; 40: Chavicol. Compounds are eluted using a HP-5 column.
.
Gas Chromatography Chromatograms of Lemon Peel, Thyme and Clove Essential Oils and Their Combination. 1: Tricyclene; 2: α-Thujene; 3: α-Pinene; 4: β-Pinene; 5: Camphene; 6: Sabinene; 7: β-Myrcene; 8: α-Terpinene; 9: p-Cymene; 10: limonene; 11: 1,8-Cineole; 12: E-β-Ocimene; 13: γ-terpinene; 14: linalool; 15: Borneol; 16: Terpinene-4-ol; 17: α-Terpineol; 18: Camphor; 19: Thymol; 20: Carvacrol; 21: Bornyl acetate; 22: Eugenol; 23: geranyl acetate; 24: eugenol acetate; 25: E-Caryophyllene; 26: Germacrene-D; 27: α-Humulene; 28: Valencene; 29: Caryophyllene oxide; 40: Chavicol. Compounds are eluted using a HP-5 column.
One of the major objectives of this study was the evaluation of the synergistic effect of the volatile compounds on the variation of the antioxidant activity of the optimized blended EO obtained by mixture design. To this end, a phytochemical characterization of the EO mixture was established at the end of the qualitative analysis of the main volatile compounds present in the mixture in order for detecting the impact of synergistic effect on the antioxidant activity of the product (Table 7).
Table 7.
Chemical Composition of Lemon Peel, Clove and Thym Essential Oils and Their Combination
|
Volatiles Compounds*
|
RIa
|
RIb
|
Lemon Peel
EO
|
Clove
EO
|
Thyme
EO
|
Combined
EO
|
| Tricyclene |
919 |
929 |
0.02 ± 0.01a |
- |
- |
- |
| α-Thujene |
923 |
836 |
0.34 ± 0.11a |
- |
- |
0.22 ± 0.01b |
| α-Pinene |
934 |
982 |
1.14 ± 0.83a |
- |
1.07 ± 0.22a |
0.52 ± 0.01b |
| β-Pinene |
937 |
1113 |
0,63 ± 0,1b |
- |
0.16 ± 0.03c |
2.12 ± 0.02a |
| Camphene |
952 |
1077 |
0.03 ± 0.01c |
- |
0.31 ± 0.06a |
0.10 ± 0.01b |
| Sabinene |
983 |
1111 |
5.82 ± 0.12a |
- |
- |
1.28 ± 0.02b |
| β-Myrcene |
991 |
1168 |
0.99 ± 0.06b |
- |
0.58 ± 0.12a |
0.41 ± 0.02a |
| α-Terpinene |
1018 |
1255 |
1.05 ± 0.04a |
- |
0.91 ± 0.19b |
0.33 ± 0.02c |
| p-Cymene |
1026 |
1277 |
0.23 ± 0.33c |
- |
7.13 ± 1.49a |
3.59 ± 0.02b |
| Limonene |
1030 |
1031 |
71.81 ± 7.71a |
- |
- |
21.30 ± 1.21b |
| 1,8-Cineole |
1033 |
1214 |
- |
0.03 ± 0.01b |
3.50 ± 0.73a |
0.09 ± 0.04b |
|
E-β-ocimene |
1052 |
1022 |
0.5 ± 0.01a |
- |
- |
0.13 ± 0.01a |
| γ-Terpinene |
1059 |
1262 |
9.96 ± 0.05a |
- |
3.44 ± 0.73b |
2.89 ± 0.02c |
| Linalol |
1098 |
1551 |
0.65 ± 0.03b |
- |
0.39 ± 0.08a |
0.28 ± 0.02c |
| Borneol |
1165 |
1642 |
2.13 ± 0.12a |
- |
0.85 ± 0.19b |
0.61 ± 0.01c |
| Terpinen-4-ol |
1178 |
1593 |
- |
- |
0.64 ± 0.13a |
0.37 ± 0.01b |
| α-Terpineol |
1185 |
1711 |
1.22 ± 0.11a |
- |
0.14 ± 0.03c |
0.42 ± 0.03b |
| Camphor |
1192 |
1498 |
0.58 ± 0.02a |
- |
- |
0.06 ± 0.01b |
| Thymol |
1266 |
1263 |
- |
- |
78.54 ± 4.50a |
25.49 ± 0.03b |
| Carvacrol |
1278 |
1283 |
0.02 ± 0.01b |
- |
0.18 ± 0.04a |
0.14 ± 0.03a |
| Bornyl acetate |
1295 |
1601 |
0.01 ± 0.01 |
- |
- |
- |
| Eugenol |
1330 |
1329 |
- |
87.3 ± 3.70a |
- |
32.35 ± 1.13b |
| Geranyl acetate |
1383 |
1599 |
0.56 ± 0.04a |
- |
- |
0.24 ± 0.01b |
| Eugenol acetate |
1387 |
1360 |
- |
10.4 ± 1.02a |
- |
5.12 ± 0.01b |
| E-caryophyllene |
1446 |
1608 |
- |
1.35 ± 0.30a |
1.58 ± 0.30a |
0.73 ± 0.03b |
| Germacrene D |
1480 |
1685 |
1.35 ± 0.04a |
0.14 ± 0.01b |
- |
- |
| α-Humulene |
1485 |
1691 |
- |
0.19 ± 0.09a |
- |
0.14 ± 0.01a |
| Valencene |
1495 |
1520 |
0.03 ± 0.01b |
- |
- |
0.12 ± 0.01a |
| Caryophyllene oxide |
1578 |
1699 |
- |
0.20 ± 0.01c |
0.57 ± 0.09a |
0.22 ± 0.03b |
| Chavicol |
1652 |
1701 |
- |
0.31 ± 0.02a |
- |
- |
| Total |
|
|
99.07 ± 0.83a |
99.92 ± 0.78a |
99.99 ± 0.71a |
99.27 ± 0.11a |
*Compounds in order of elution on HP-5 MS. Volatile compounds percentages in the same line with different letters (a–c) are significantly different at P < 0.05. RIa RIb: retention indices calculated using, respectively, an apolar column (HP-5) and polar column (HP-INNOWax).
Likewise, for accurately assessing the synergistic effect of volatile compounds on the variation of antioxidant activity, a statistical analysis was performed using multivariate analysis through PCA. This analysis was interesting regarding the laws of probability with several variables for revealing the relations between the individuals to be tested (Figure 4).
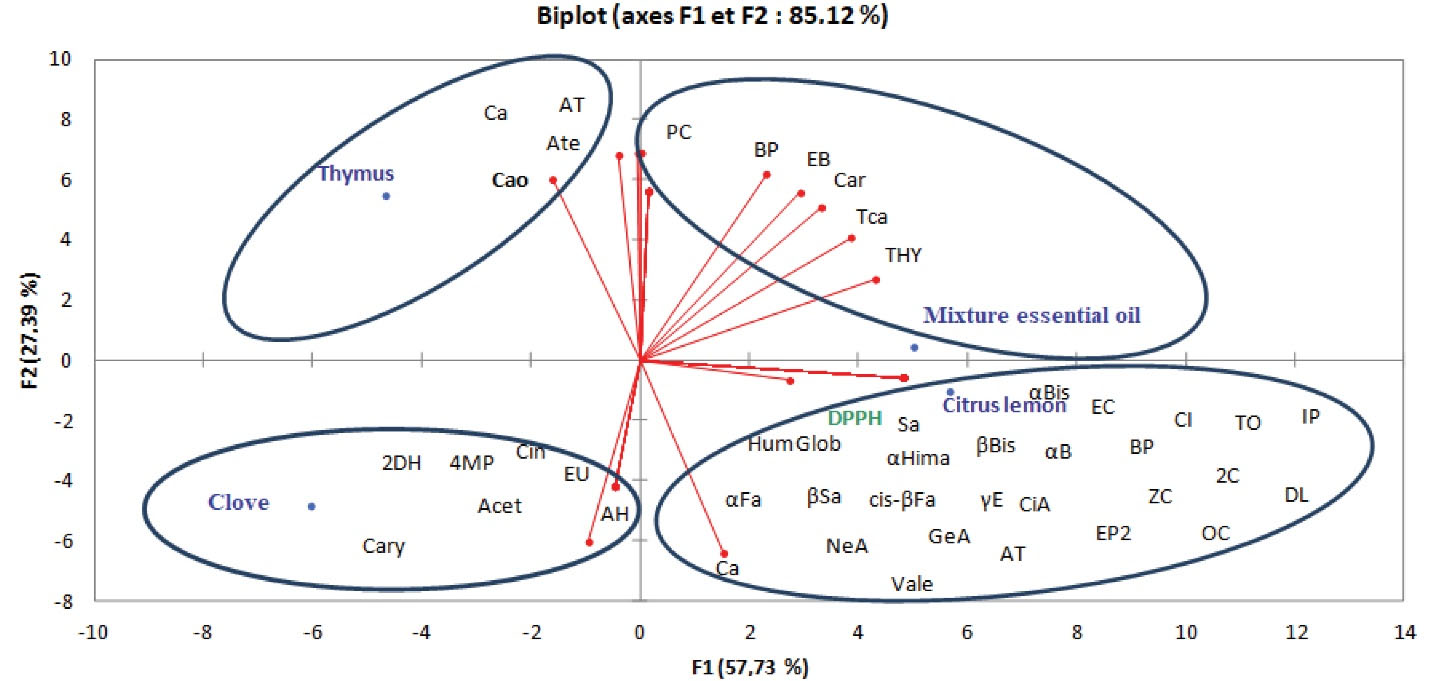
Figure 4.
Principal Component Analysis to Assess the Correlation Between the Free Radical Scavenging Activity and the Chemical Composition of Clove, Thyme and Lemon Peel Essential Oils and Their Optimized Mixture by Mixing Plan. 1,8-Cineole (Cin), Eugenol (EU), alpha.-Humulene (AH), Acetyleugenol (Acet), Caryophyllene (Cary), Camphor (Ca); alpha-Terpineol (AT); alpha-Terpinene (Ate), Caryophyllene oxide (Cao), Thymol (THY); trans-Caryophyllene (Tca); p-Cymene (PC); beta-Phellandrene (BP); endo-Borneol (EB) and Carvacrol (Car).
.
Principal Component Analysis to Assess the Correlation Between the Free Radical Scavenging Activity and the Chemical Composition of Clove, Thyme and Lemon Peel Essential Oils and Their Optimized Mixture by Mixing Plan. 1,8-Cineole (Cin), Eugenol (EU), alpha.-Humulene (AH), Acetyleugenol (Acet), Caryophyllene (Cary), Camphor (Ca); alpha-Terpineol (AT); alpha-Terpinene (Ate), Caryophyllene oxide (Cao), Thymol (THY); trans-Caryophyllene (Tca); p-Cymene (PC); beta-Phellandrene (BP); endo-Borneol (EB) and Carvacrol (Car).
The statistical analysis obtained by carrying out the principal component analysis and the Person correlation analysis (which assess the correlation between the free radical scavenging activity and the chemical composition of these EOs) and their optimized mixture by a mixing plan showed that the free radical scavenging activity is positively correlated with the EO of lemon peel that proved a weak antioxidant activity. Secondly, a positive correlation was identified between free radical scavenging activity and the EO of clove, thyme, and lemon peel of the optimized mixture, which was suggestive of a considerable antioxidant activity.
These results were consolidated by the results from Person’s correlation analysis which proved that the antioxidant activity of each EO was largely attributable to the synergy between certain volatile compounds present in the composition of each EO. In effect, the considerable activity in the EO of clove resulted from the presence of the compounds 1,8-cineole, eugenol, α.-humulene, eugenol acetate, and E-caryophyllene with the negative correlation coefficients of -0.648, -0.648, -0.648, -0.648, and -0.414, respectively. In addition, the considerable antioxidant activity in the EO from the common thyme leaves was attributable to the presence of the compounds camphor, α-terpineol, α-terpinene, and caryophyllene oxide with the negative correlation coefficients of -0.333, -0.261, -0.272, and -0.600, respectively. However, the considerable antioxidant activity of the optimized blend EO occurred when it was formulated using the proposed ingredient contents of 25.7% EOT (X1), 32.3% EOL (X2), and 41.9 % EOC (X3) resulted from the synergy between the following compounds: thymol; trans-caryophyllene, p-cymene, beta-phellandrene, borneol, and carvacrol with the negative correlation coefficients of -0.552, -0.552, -0.552, -0.552, -0.552, and -0.552, respectively.
Discussion
In this study, the optimization of the antioxidant activity was investigated by adopting the mixing plan of a mixture of clove, lemon peel, and thyme EOs.
According to the plot graphs, it was shown that the optimization using the mixing plan resulted in the potent antioxidant activity of the EO mixture (IC50 = 11.023 ± 0.145 µg/mL). This result was proportional to the proposed ingredient levels 25.7% EOT (X1), 32.3% EOL (X2) and 41.9 % EOC (X3) equivalent to 15.42 mg, 19.38 mg and 25.14 mg of the total EO mixture. In addition, taking into account the statistical examinations, it was found that the EO content of lemon peel (EOC (X2)) (b2) may have influenced the antioxidant activity (Y: (IC50: DPPH)).
Similar results were reported by Baj et al (11) who highlighted the usefulness of statistical modeling of antioxidant activity, which was used to design a mixture of marjoram, basil, and rosemary EOs. Indeed, it was detected that the highest antioxidant activity was obtained for a mixed percentage of 75, 8, 17, respectively. However, the designed mixture showed a higher inhibition percentage (90%) compared to that of marjoram oil (88%) which was the most active oil.
Similarly, a qualitative analysis of the main volatile compounds of the EOs’ mixture based on the antioxidant activity facilitated the evaluation of the effect of the synergy between the volatile compounds and the variation of antioxidant activity. In our study, lemon peel EO was characterized by the predominance of limonene (71.81 ± 0.78%). Eugenol (87.3 ± 3.70%) was the main component in clove EO, and thymol (78.54 ± 4.50%) was the major one in thyme EO. In other words, the combined EO was mainly rich in eugenol (32.35 ± 1.13%), thymol (25.49 ± 0.03%) and limonene (21.30 ± 0.02%). Our results regarding the chemical composition of lemon peel were in line with the findings from other studies confirming that limonene was the main component ranging from 29.52 to 98.40% (12-22). The major component of clove EO is usually considered eugenol (34.10-88.58%) (23-26). Numerous other studies have also introduced the EO composition of thyme with thymol as the main constituent ranging from 22 to 71% (27-30).
According to the results from PCA and Person’s correlation analysis, the considerable activity in the EO of clove results from the presence of the compounds 1,8-cineole, eugenol, α.-humulene, eugenol acetate, and E-caryophyllene which have the following negative correlation coefficients of -0.648, -0.648, -0.648, -0.648; and -0.414, respectively. In addition, the considerable antioxidant activity in the EO from common thyme leaves was attributable to the presence of the compounds camphor, α-terpineol, α-terpinene, and caryophyllene oxide with the negative correlation coefficients of -0.333, -0.261, -0.272, and -0.600, respectively. However, the considerable antioxidant activity of the optimized blend EO occurred when it was formulated using the proposed ingredient contents of 25.7% EOT (X1), 32.3% EOL (X2), and 41.9 % EOC (X3). This considerable antioxidant activity results from the presence of the compounds thymol; trans-caryophyllene, p-cymene, beta-phellandrene, borneol and carvacrol which have the following negative correlation coefficients of -0.552, -0.552, -0.552, -0.552, -0.552, and -0.552, respectively. These results were in agreement with findings of a study by Sonam and Guleria (31), which proved that the antioxidant potential may have been increased by the synergistic interactions among the different antioxidant compounds present in the mixture of synthetic antioxidants and natural products or the mixture of different EOs from aromatic and medicinal plants.
Conclusion
In this work, statistical modelling was utilized to design a mixture of three EOs, namely thyme, lemon peel, and clove. The highest antioxidant activities were obtained for 25.7% EOT, 32.3% EOL, and 41.9% EOC. The EO mixture was mainly rich in eugenol (32.35 ± 1.13%), thymol (25.49 ± 0.03%), and limonene (21.30 ± 0.02%); and it had a stronger antioxidant activity than those of each individual EOs. Therefore, statistical planning and the development of utility profiles for mixtures of EOs may have been used to predict the optimal composition as well as to determine their antioxidant profile.
Acknowledgments
The authors are grateful for all staff in the Laboratory of Aromatic and Medicinal Plants, Borj Cedria Biotechnology Center.
Authors’ Contribution
Conceptualization, WY; Writing, WY, IM, WAW, TGA; Methodology, WY, MH, SK; Investigation, WY, Formal analysis, WY, IM, MH; Data curation, WAW; Supervision, MST; All authors have read and agreed to the published version of the manuscript.
Conflict of Interests
None.
Ethical Issues
None.
Funding/Support
This work was supported by the Tunisian Ministry of Higher Education and Scientific Research.
References
- Sihoglu Tepe A, Ozaslan M. Anti-Alzheimer, anti-diabetic, skin-whitening, and antioxidant activities of the essential oil of Cinnamomum zeylanicum. Ind Crops Prod 2020; 145:112069. doi: 10.1016/j.indcrop.2019.112069 [Crossref] [ Google Scholar]
- Sobrinho ACN, de Souza EB, Rocha MF, Albuquerque MR, Bandeira PN, dos Santos HS. Chemical composition, antioxidant, antifungal and hemolytic activities of essential oil from Baccharis trinervis (Lam) Pers (Asteraceae). Ind Crops Prod 2016; 84:108-15. doi: 10.1016/j.indcrop.2016.01.051 [Crossref] [ Google Scholar]
- Yakoubi R, Megateli S, Hadj Sadok T, Bensouici C, Bağci E. A synergistic interactions of Algerian essential oils of Laurus nobilis L, Lavandula stoechas L and Mentha pulegium L on anticholinesterase and antioxidant activities. Biocatal Agric Biotechnol 2021; 31:101891. doi: 10.1016/j.bcab.2020.101891 [Crossref] [ Google Scholar]
- Aumeeruddy-Elalfi Z, Gurib-Fakim A, Mahomoodally MF. Kinetic studies of tyrosinase inhibitory activity of 19 essential oils extracted from endemic and exotic medicinal plants. S Afr J Bot 2016; 103:89-94. doi: 10.1016/j.sajb.2015.09.010 [Crossref] [ Google Scholar]
- Pei RS, Zhou F, Ji BP, Xu J. Evaluation of combined antibacterial effects of eugenol, cinnamaldehyde, thymol, and carvacrol against E coli with an improved method. J Food Sci 2009; 74(7):M379-83. doi: 10.1111/j.1750-3841.2009.01287.x [Crossref] [ Google Scholar]
- Goñi P, López P, Sánchez C, Gómez-Lus R, Becerril R, Nerín C. Antimicrobial activity in the vapour phase of a combination of cinnamon and clove essential oils. Food Chemistry 2009; 116(4):982-9. doi: 10.1016/j.foodchem.2009.03.058 [Crossref] [ Google Scholar]
- Bassolé IH, Juliani HR. Essential oils in combination and their antimicrobial properties. Molecules 2012; 17(4):3989-4006. doi: 10.3390/molecules17043989 [Crossref] [ Google Scholar]
- Zaouali Y, Bouzaine T, Boussaid M. Essential oils composition in two Rosmarinus officinalis L varieties and incidence for antimicrobial and antioxidant activities. Food Chem Toxicol 2010; 48(11):3144-52. doi: 10.1016/j.fct.2010.08.010 [Crossref] [ Google Scholar]
- Hatano T, Kagawa H, Yasuhara T, Okuda T. Two new flavonoids and other constituents in licorice root: their relative astringency and radical scavenging effects. Chem Pharm Bull (Tokyo) 1988; 36(6):2090-7. doi: 10.1248/cpb.36.2090 [Crossref] [ Google Scholar]
- Crespo YA, Bravo Sánchez LR, Quintana YG, Cabrera AST, Bermúdez Del Sol A, Mayancha DMG. Evaluation of the synergistic effects of antioxidant activity on mixtures of the essential oil from Apium graveolens L, Thymus vulgaris L and Coriandrum sativum L using simplex-lattice design. Heliyon 2019; 5(6):e01942. doi: 10.1016/j.heliyon.2019.e01942 [Crossref] [ Google Scholar]
- Baj T, Baryluk A, Sieniawska E. Application of mixture design for optimum antioxidant activity of mixtures of essential oils from Ocimumbasilicum L, Origanum majorana L and Rosmarinus officinalis L. Ind Crops Prod 2018; 115:52-61. doi: 10.1016/j.indcrop.2018.02.006 [Crossref] [ Google Scholar]
- Ayedoun AM, Sossou PV, Mardarowicz M, Leclercq PA. Volatile constituents of the peel and leaf oils of Citrus limon L Burm f from Benin. J Essent Oil Res 1996; 8(4):441-4. doi: 10.1080/10412905.1996.9700661 [Crossref] [ Google Scholar]
- Mahalwal VS, Ali M. Volatile constituents of the fruits peels of Citrus lemon (Linn) Burm F. J Essent Oil Bear Plants 2003; 6(1):31-5. doi: 10.1080/0972-060x.2003.10643325 [Crossref] [ Google Scholar]
- Yoo ZW, Kim NS, Lee DS. Comparative analyses of the flavors from Hallabong (Citrus sphaerocarpa) with lemon, orange and grapefruit by SPTE and HS-SPME combined with GC-MS. Bull Korean Chem Soc 2004; 25(2):271-9. doi: 10.5012/bkcs.2004.25.2.271 [Crossref] [ Google Scholar]
- Monajemi R, Oryan S, Haeri Rouhani SA, Ghanadi AR, Jafarian Dehkordi A. Cytotoxic effects of essential oils of some Iranian Citrus peels. Iran J Pharm Res 2005; 4(3):183-7. [ Google Scholar]
- Kamal GM, Anwar F, Hussain AI, Sarri N, Ashraf MY. Yield and chemical composition of Citrus essential oils as affected by drying pretreatment of peels. Int Food Res J 2011; 18(4):1275-82. [ Google Scholar]
- Jomaa S, Rahmo A, Alnori AS, Chatty ME. The cytotoxic effect of essential oil of Syrian Citrus limon peel on human colorectal carcinoma cell line (Lim1863). Middle East J Cancer 2012; 3(1):15-21. [ Google Scholar]
- Bertuzzi G, Tirillini B, Angelini P, Venanzoni R. Antioxidative action of Citrus limonum essential oil on skin. European J Med Plants 2013; 3(1):1-9. [ Google Scholar]
- Wu PS, Kuo YT, Chen SM, Li Y, Lou BS. Gas chromatography-mass spectrometry analysis of photosensitive characteristics in Citrus and herb essential oils. J Chromatogr Sep Tech 2014; 6(1):261. doi: 10.4172/2157-7064.1000261 [Crossref] [ Google Scholar]
- Hong JH, Khan N, Jamila N, Hong YS, Nho EY, Choi JY. Determination of volatile flavour profiles of Citrus spp Fruits by SDE-GC-MS and enantiomeric composition of chiral compounds by MDGC-MS. Phytochem Anal 2017; 28(5):392-403. doi: 10.1002/pca.2686 [Crossref] [ Google Scholar]
- Himed L, Merniz S, Monteagudo-Olivan R, Barkat M, Coronas J. Antioxidant activity of the essential oil of Citrus limon before and after its encapsulation in amorphous SiO2. Sci Afr 2019; 6:e00181. doi: 10.1016/j.sciaf.2019.e00181 [Crossref] [ Google Scholar]
- Kaskoos RA. Essential oil analysis by GC-MS and analgesic activity of Lippia citriodora and Citrus limon. J Essent Oil Bear Plants 2019; 22(1):273-81. doi: 10.1080/0972060x.2019.1603123 [Crossref] [ Google Scholar]
- Prashar A, Locke IC, Evans CS. Cytotoxicity of clove (Syzygiumaromaticum) oil and its major components to human skin cells. Cell Prolif 2006; 39(4):241-8. doi: 10.1111/j.1365-2184.2006.00384.x [Crossref] [ Google Scholar]
- Chaieb K, Hajlaoui H, Zmantar T, Kahla-Nakbi AB, Rouabhia M, Mahdouani K. The chemical composition and biological activity of clove essential oil, Eugenia caryophyllata (Syzigiumaromaticum L Myrtaceae): a short review. Phytother Res 2007; 21(6):501-6. doi: 10.1002/ptr.2124 [Crossref] [ Google Scholar]
- Pinto E, Vale-Silva L, Cavaleiro C, Salgueiro L. Antifungal activity of the clove essential oil from Syzygiumaromaticum on Candida, Aspergillus and dermatophyte species. J Med Microbiol 2009; 58(11):1454-62. doi: 10.1099/jmm.0.010538-0 [Crossref] [ Google Scholar]
- Sulistyoningrum AS, Saepudin E, Cahyana AH, Rahayu DUC, Amelia B, Haib J. Chemical profiling of clove bud oil (Syzygiumaromaticum) from Toli-Toli and Bali by GC-MS analysis. AIP Conf Proc 2017; 1862(1):030089. doi: 10.1063/1.4991193 [Crossref] [ Google Scholar]
- Hudaib M, Speroni E, Di Pietra AM, Cavrini V. GC/MS evaluation of thyme (Thymus vulgaris L) oil composition and variations during the vegetative cycle. J Pharm Biomed Anal 2002; 29(4):691-700. doi: 10.1016/s0731-7085(02)00119-x [Crossref] [ Google Scholar]
- Zambonelli A, D’Aulerio AZ, Severi A, Benvenuti S, Maggi L, Bianchi A. Chemical composition and fungicidal activity of commercial essential oils of Thymus vulgaris L. J Essent Oil Res 2004; 16(1):69-74. doi: 10.1080/10412905.2004.9698653 [Crossref] [ Google Scholar]
- Shabnum S, Wagay MG. Essential oil composition of Thymus vulgaris L and their uses. J Res Dev 2011; 11:83-94. [ Google Scholar]
- Kowalczyk A, Przychodna M, Sopata S, Bodalska A, Fecka I. Thymol and thyme essential oil-new insights into selected therapeutic applications. Molecules 2020; 25(18):4126. doi: 10.3390/molecules25184125 [Crossref] [ Google Scholar]
- Sonam KS, Guleria S. Synergistic antioxidant activity of natural products. Ann Pharmacol Pharm 2017; 2(8):1086. [ Google Scholar]