Avicenna Journal of Medical Biochemistry. 8(2):99-111.
doi: 10.34172/ajmb.2020.15
Research Article
Identifying Potential Biomarkers in Colorectal Cancer and Developing Non-invasive Diagnostic Models Using Bioinformatics Approaches
Massoud Saidijam 1, Saeid Afshar 1, Amir Taherkhani 2, * 
Author information:
1Department of Molecular Medicine and Genetics, Research Center for Molecular Medicine, Hamadan University of Medical Sciences, Hamadan, Iran.
2Research Center for Molecular Medicine, Hamadan University of Medical Sciences, Hamadan, Iran.
Abstract
Background: Colorectal cancer (CRC) is one of the most frequent causes of gastrointestinal tumors. Due to the invasiveness of the current diagnostic methods, there is an urgent need to develop non-invasive diagnostic approaches for CRC. The exact mechanisms and the most important genes associated with the development of CRC are not fully demonstrated.
Objectives: This study aimed to identify differentially expressed miRNAs (DEMs), key genes, and their regulators associated with the pathogenesis of CRC. The signaling pathways and biological processes (BPs) that were significantly affected in CRC were also indicated. Moreover, two non-invasive models were constructed for CRC diagnosis.
Methods: The miRNA dataset GSE59856 was downloaded from the Gene Expression Omnibus (GEO) database and analyzed to identify DEMs in CRC patients compared with healthy controls (HCs). A protein-protein interaction (PPI) network was built and analyzed. Significant clusters in the PPI networks were identified, and the BPs and pathways associated with these clusters were studied. The hub genes in the PPI network, as well as their regulators were identified.
Results: A total of 569 DEMs were demonstrated with the criteria of P value <0.001. A total of 110 essential genes and 30 modules were identified in the PPI network. Functional analysis revealed that 1005 BPs, 9 molecular functions (MFs), 14 cellular components (CCs), and 887 pathways were significantly affected in CRC. A total of 22 transcription factors (TFs) were demonstrated as the regulators of the hubs.
Conclusion: Our results may provide new insight into the pathogenesis of CRC and advance the diagnostic and therapeutic methods of the disease. However, confirmation is required in the future.
Keywords: Biomarkers, Colorectal neoplasms, Genes, Machine learning, microRNAs, Protein interaction maps
Copyright and License Information
© 2020 The Author(s); Published by Hamadan University of Medical Sciences.
This is an open-access article distributed under the terms of the Creative Commons Attribution License (
http://creativecommons.org/licenses/by/4.0), which permits unrestricted use, distribution, and reproduction in any medium provided the original work is properly cited.
Background
According to a report on colorectal cancer (CRC), the Global Burden of Disease study estimated that 1.8 million of the world’s population were affected by CRC in 2017, causing 896 000 global deaths (1). CRC is known as the third and second frequent cause of global cancer mortality in males and females, respectively (2,3). Therefore, CRC is one of the most frequent causes of malignancies worldwide (4,5). One of the problems associated with CRC is that most of the patients with CRC are diagnosed at the late stages of the disease when the tumor cells have metastasized to other organs. Therefore, there are no early clinical signs to be used for diagnosis before the disease enters an irretrievable stage. Notably, it was reported that CRC could be treated at early stages, and the 5-year relative survival rate was 90% (4,6,7). To date, the screening methods for CRC include colonoscopy (3), fecal immunochemical test (8), multi-target stool DNA testing (9), and methylated septin9 (mSEPT9) assay (10). The gold standard approach for the diagnosis of CRC is based on colonoscopy, which is an invasive method and has some complications (11). Although the other mentioned screening methods provide non-invasive approaches to detect CRC, the sensitivity and specificity of the techniques are not satisfactory for scientists (3,9,12). Therefore, alternative non-invasive procedures are highly required using applicable biomarker signatures and novel bioinformatics technologies for early diagnosis and enhancing CRC survival rate.
Although many studies have been performed to reveal the molecular mechanisms underlying CRC, the exact biological processes (BPs), molecular functions (MFs), cellular components (CCs), enriched pathways, and the most important genes and regulators involved in CRC are not entirely revealed yet (13,14).
The miRNAs are noncoding ribonucleic acids and consisted of almost 16-22 nucleotides. They bind to their complementary sequences located at the target mRNAs leading to either degradation of the target mRNA or inhibition of protein production (15-17). It has been demonstrated that dysregulation of miRNAs is frequent in cancer, and the pathological origin of cancer is directly associated with changes in expression of these molecules. Although miRNAs are tissue-specific, previous studies reported that they are transferred into the circulation in several ways, such as passive leakage of apoptosis, necrosis (the environment inflammation), exosomes/microvesicles, lipoproteins, and RNA-protein complexes. Numerous studies have confirmed that the alteration in expression of circulating miRNAs is related to the origin, progression, therapeutic response, and patient survival of the disease (3,18-23). Accordingly, circulating miRNAs have become encouraging candidates for non-invasive molecular biomarkers of malignancy (18).
In recent years, scientists have used machine learning tools (MLTs) to resemble predictive models and to classify the groups under study (24). It has been confirmed that the results of classification performed by MLTs are more reliable in comparison with clustering algorithms such as principal component analysis (25). Support vector machine (SVM), as an MLT method, is a type of supervised learning algorithm with the salient advantages of average model statistics, including sensitivity, specificity, accuracy, and area under the curve (AUC), besides reducing the time cost in the training step (3,26,27). Moreover, SVM can successfully mine data obtained from ‘-omics-’ technologies, including microarray gene expression, proteomics, and metabolomics approaches (28).
Systems biology is a field of science that clarifies the meaning of an extensive amount of data derived from ‘-omics-’ technologies (29). These technologies refer to high-throughput techniques that can potentially detect a large number of molecules (e.g., gene, transcript, protein, and metabolite) in biological samples, including serum, plasma, urine, tissue, and cerebrospinal fluid (30). In the present study, we performed a systems biology approach to identify differentially expressed microRNAs (miRNAs) (DEMs) between CRC samples and healthy controls (HCs) by mining microarray dataset GSE59856 (31).
Diagnostic models were constructed by SVM classifier using 1) DEMs and 2) the top-ranked miRNAs based on their weight coefficient in the initial diagnostic model. In addition, a protein-protein interaction (PPI) network was constructed based on the DEMs-target gene using the Mentha (32), InnateDB (33), ChEMBL (34), and Reactome (35) databases. The PPI network was analyzed using the Cytoscape software. Moreover, the most important genes, enriched gene ontology (GO) terms, and pathways involved in the pathogenesis of CRC were identified. Additionally, a gene regulatory network (GRN) base on the hub genes found in the PPI network was assembled to identify the regulatory transcription factors (TFs) associated with the disease.
Material and Methods
Microarray Data Set Acquisition
In the current study, we aimed to identify significant DEMs that can be provided as a capable diagnostic panel of biomarkers for patients with CRC. Micro-RNA expression profile of GSE59856 (31) was downloaded from the publicly available National Center for Biotechnology Information Gene Expression Omnibus database (NCBI GEO, http://www.ncbi.nlm.nih.gov/geo) (36). GSE59856 consisted of 571 serum samples of different patients, including 50 CRC and 150 HCs based on the GPL18941 platform (3D-Gene Human miRNA V20_1.0.0).
Statistical Analysis
Raw microarray data were acquired as a TXT file from the GEO database. Min-max normalization was applied using R programming environment (version 3.6.0) before statistical analysis. Orthogonal partial least squares (OPLS) was applied as an advanced supervised multivariate modeling. The microarray technology is frequently used for biomarker discovery (37). The outcome of this technique contains a large number of variables and small number of samples, which is well-known as high-throughput data. Multivariate statistical analyses (e.g., OPLS) are suitable for analyzing these types of data (38,39). This was done by using the “ropls” package from the R programming environment (version 3.6.0). The DEMs with a P value < 0.001 were considered to be statistically significant.
Support Vector Machine Modeling
The SVM algorithm was utilized by performing the e1071 R package (version 1.6-8; https://cran.r-project.org/web/packages/e1071) for the classification of CRC and HCs. SVM is a supervised MLT for two-group classification with salient advantages, including high average classification sensitivity, specificity, and accuracy, besides lowering time cost in the training step (26,27). Two models were built using different sets of variables, which were as follows: 1) DEMs with a P < 0.001, and 2) the top three ranked miRNAs based on their weight coefficient in the primary model. The radial kernel was implemented in SVM modeling, and the models were validated using leave-one-out (LOO) cross-validation, repeating 100 times for each model. The three major statistics for a model, including sensitivity (Sn), specificity (Sp), and accuracy (ACC) were determined. The receiver operating characteristic (ROC) curves were generated using the Epi R package (version 2.19; https://cran.rproject.org/web/packages/Epi) to evaluate the diagnostic ability of the SVM models. The major statistics for the models were calculated after performing each time LOO. Next, the average of the measurements was also determined. Furthermore, the AUC for each model was calculated after integrating the results over the 100 iterations of LOO cross-validations.
PPI Network and Gene Set Enrichment Analyses
We used the MiRWalk 2.0 database (http://zmf.umm.uni-heidelberg.de/apps/zmf/mirwalk2/index.html) to identify validated DEMs-target genes (40). Subsequently, a set of proteins associated with the target genes was obtained and integrated from the Mentha (32), InnateDB (33), ChEMBL (34), and Reactome (35) databases. The non-human proteins were excluded from the dataset. Cytoscape tool (version 3.7.1; https://cytoscape.org/) was utilized to construct the PPI network. The PPI network is used to study the comprehensive activities and biological procedures in living systems (41). It is noteworthy that the interaction between two proteins could be either physical or functional (29,42). The ‘molecular complex detection’ (MCODE) plugin was used to determine highly dense connected zones in the PPI network. MCODE identifies condensed regions (known as clusters [modules]) in a PPI network, especially based on the neighborhood density of the nodes (43). In addition, MCODE can find the vertex of a cluster known as a seed node, based on the actual knowledge about the biological functions of the nodes (44). The advanced options for the MCODE were as follows: minimum score for clusters, 2; number of nodes involved in each cluster, ≥2; maximum depth from seed, 100; and node score cutoff, 0.2. The ClueGO plugin (v2.3.3; Laboratory of Integrative Cancer Immunology, Paris, France) and the Reactome database (https://reactome.org/) (45) were used to analyze the enriched BP category and pathways of the most critical clusters associated with CRC, respectively. ClueGO integrates the Kyoto Encyclopedia of Genes and Genomes, and BioCarta pathways to detect functionally correlated GO terms (46). In addition, the Protein ANalysis THrough Evolutionary Relationships (PANTHER) webserver (http://www.pantherdb.org/) (47) was utilized to identify the enriched MFs and CCs of the DEMs-target genes associated with CRC. The GO terms and pathways enriched with false discovery rate (FDR) < 0.05 were considered statistically significant. The Network Analyzer tool was used to calculate the topological features of all the nodes in the network. Degree, betweenness, closeness, and eccentricity of the nodes were calculated to identify the most critical genes in the network. Accordingly, the nodes that had a betweenness and degree greater than 2-fold the mean, besides having a centrality and eccentricity higher than the average of the nodes in the network were considered as hub nodes.
Gene Regulatory Network Analyses
The iRegulon plugin was utilized to identify and visualize GRNs, known as motifs, including the determined hub genes and upstream regulatory TFs. It is notable that iRegulon performs an approach known as a genome-wide ranking-and-recovery technique to identify the motifs, by which all of the genes are scored in the genome through motif detection. Next, a normalized enrichment score (NES) was calculated for all of the TFs for each set of regulons. The NES determines the significance of the detected motif and is correlated with the AUC value of the motif (48-50).
Results
Identification of DEMs in CRC
A predictive model was built using OPLS for the normalized dataset consisted of 200 observations (HC, 150; CRC, 50) and 2478 features. The statistics of the model were as follows: R2X = 0.101, R2Y = 0.93, and Q2 = 0.873, proposing that the model was statistically robust and able to distinguish CRC from HCs. A total of 569 miRNAs were determined as statistically discriminating variables for CRC compared with the healthy individuals from the OPLS diagnostic model, including 316 down- and 253 up-regulated miRNAs. All DEMs were considered to be a potential panel of biomarkers for the diagnosis of CRC. They all had a P value < 0.001 (Table S1, Supplementary file 1).In addition, the expression heat map of the top 34 down-regulated (fold change < 0.25) and the top 6 up-regulated (fold change > 4) DEMs were presented in Figure 1.
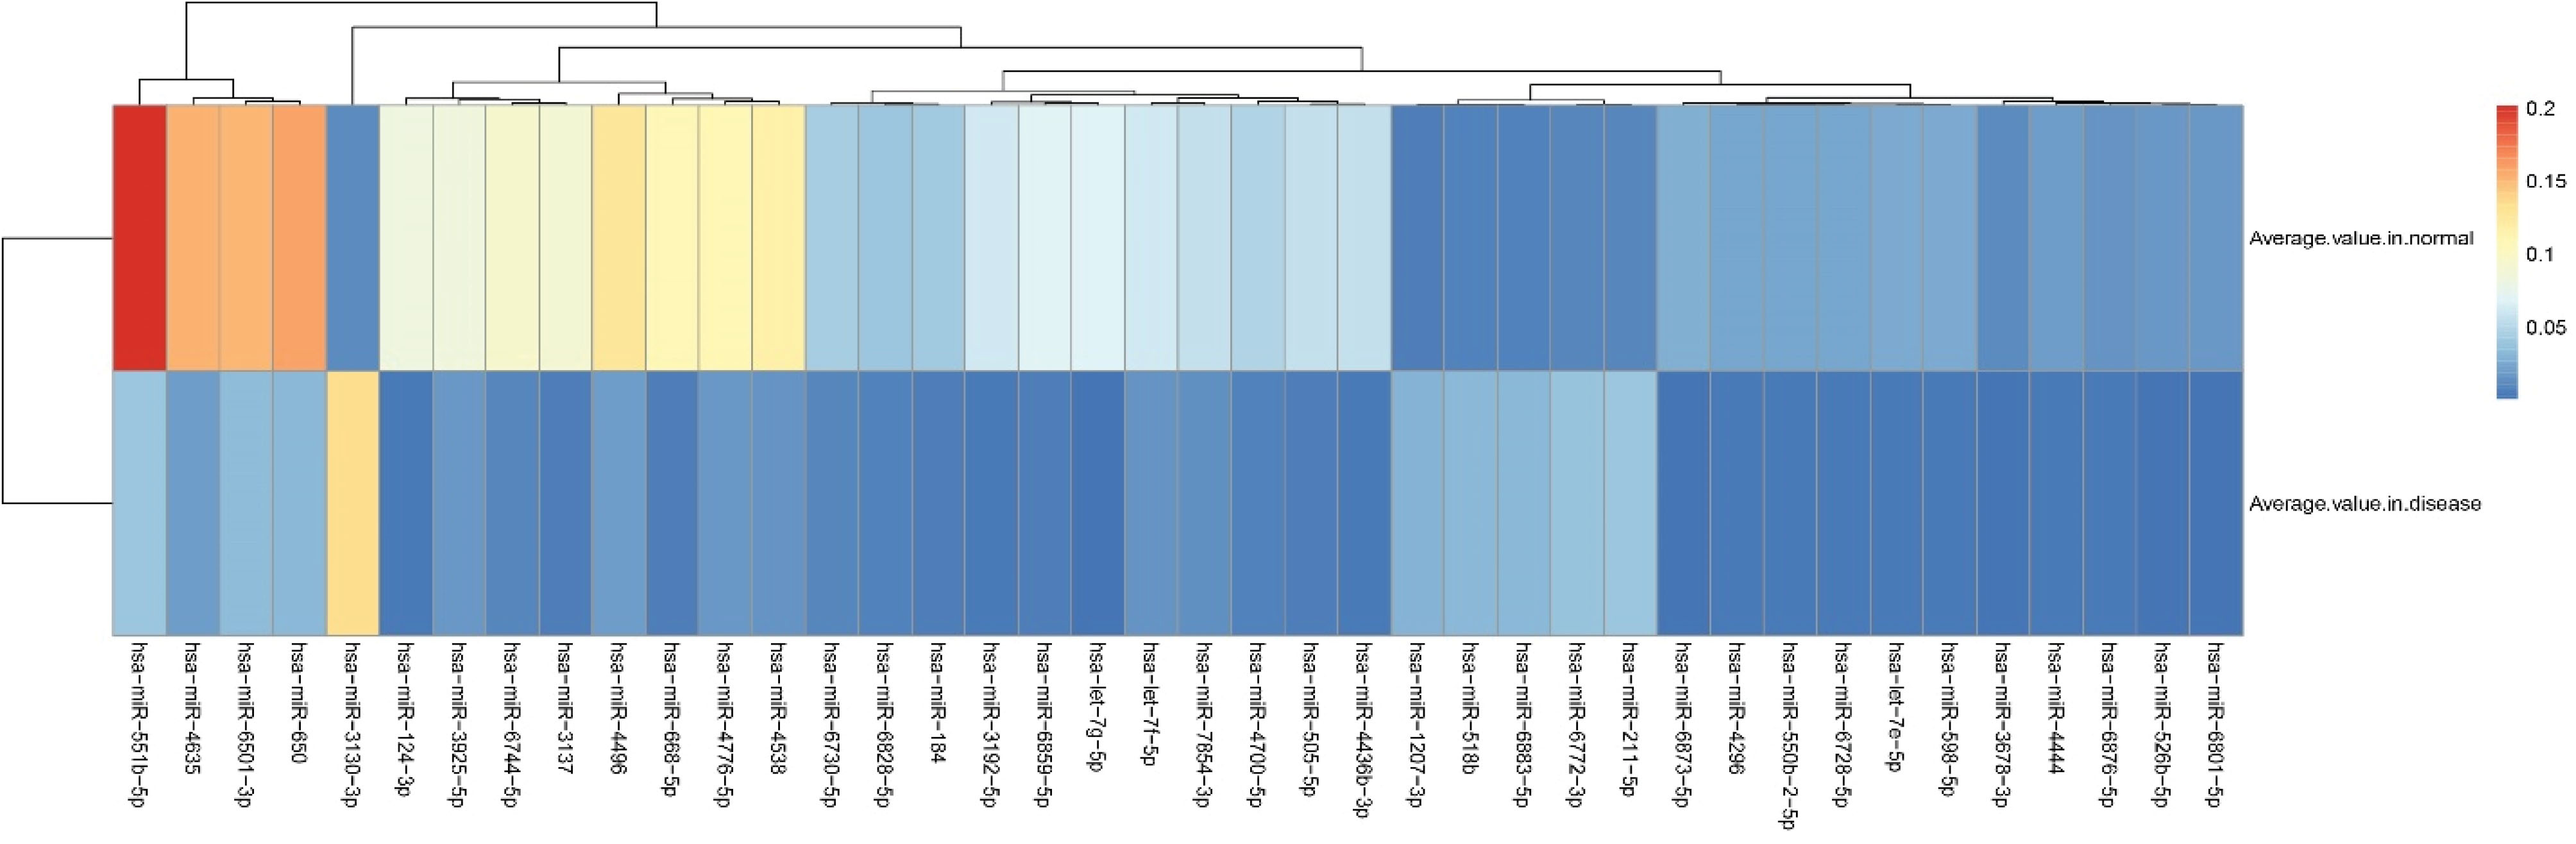
Figure 1.
Hierarchical Clustering and Heat-map of the Top 40 DEMs. Note. Red and blue represent the high and low expression of the miRNA, respectively. DEM, differentially expressed miRNA.
.
Hierarchical Clustering and Heat-map of the Top 40 DEMs. Note. Red and blue represent the high and low expression of the miRNA, respectively. DEM, differentially expressed miRNA.
SVM Classifiers and Statistical Validation
Two predictive SVM models for CRC classification were constructed using 1) the primary dataset consisting of 569 identified DEMs, and 2) the top three ranked miRNAs, including MIMAT0027353, MIMAT0031005, and MIMAT0019715 based on their weight coefficient with the radial SVM algorithm. The weight coefficients for the top 10 features are demonstrated in Figure 2. It should be noted that the SVM algorithm is vigorous in managing noisy data, besides being resistant against outliers, which is appropriate for classifying high-throughput datasets such as microarray gene expression (51). In the current study, the average statistics of the models over the 100 iterations of LOO cross-validations were as follows: Sn = 1, Sp = 0.99, ACC = 0.99 using the primary dataset, and Sn = 0.96, Sp = 0.99, ACC = 0.98 on the final dataset. Moreover, the models were classified as the CRC versus healthy individuals with an AUC of 1 and 0.99 using the 569 DEMs and top three ranked miRNAs, respectively (Figure 3). The details of calculations related to each of the SVM models are presented in Table S2. Furthermore, Table 1 illustrates the parameters of the SVM models.
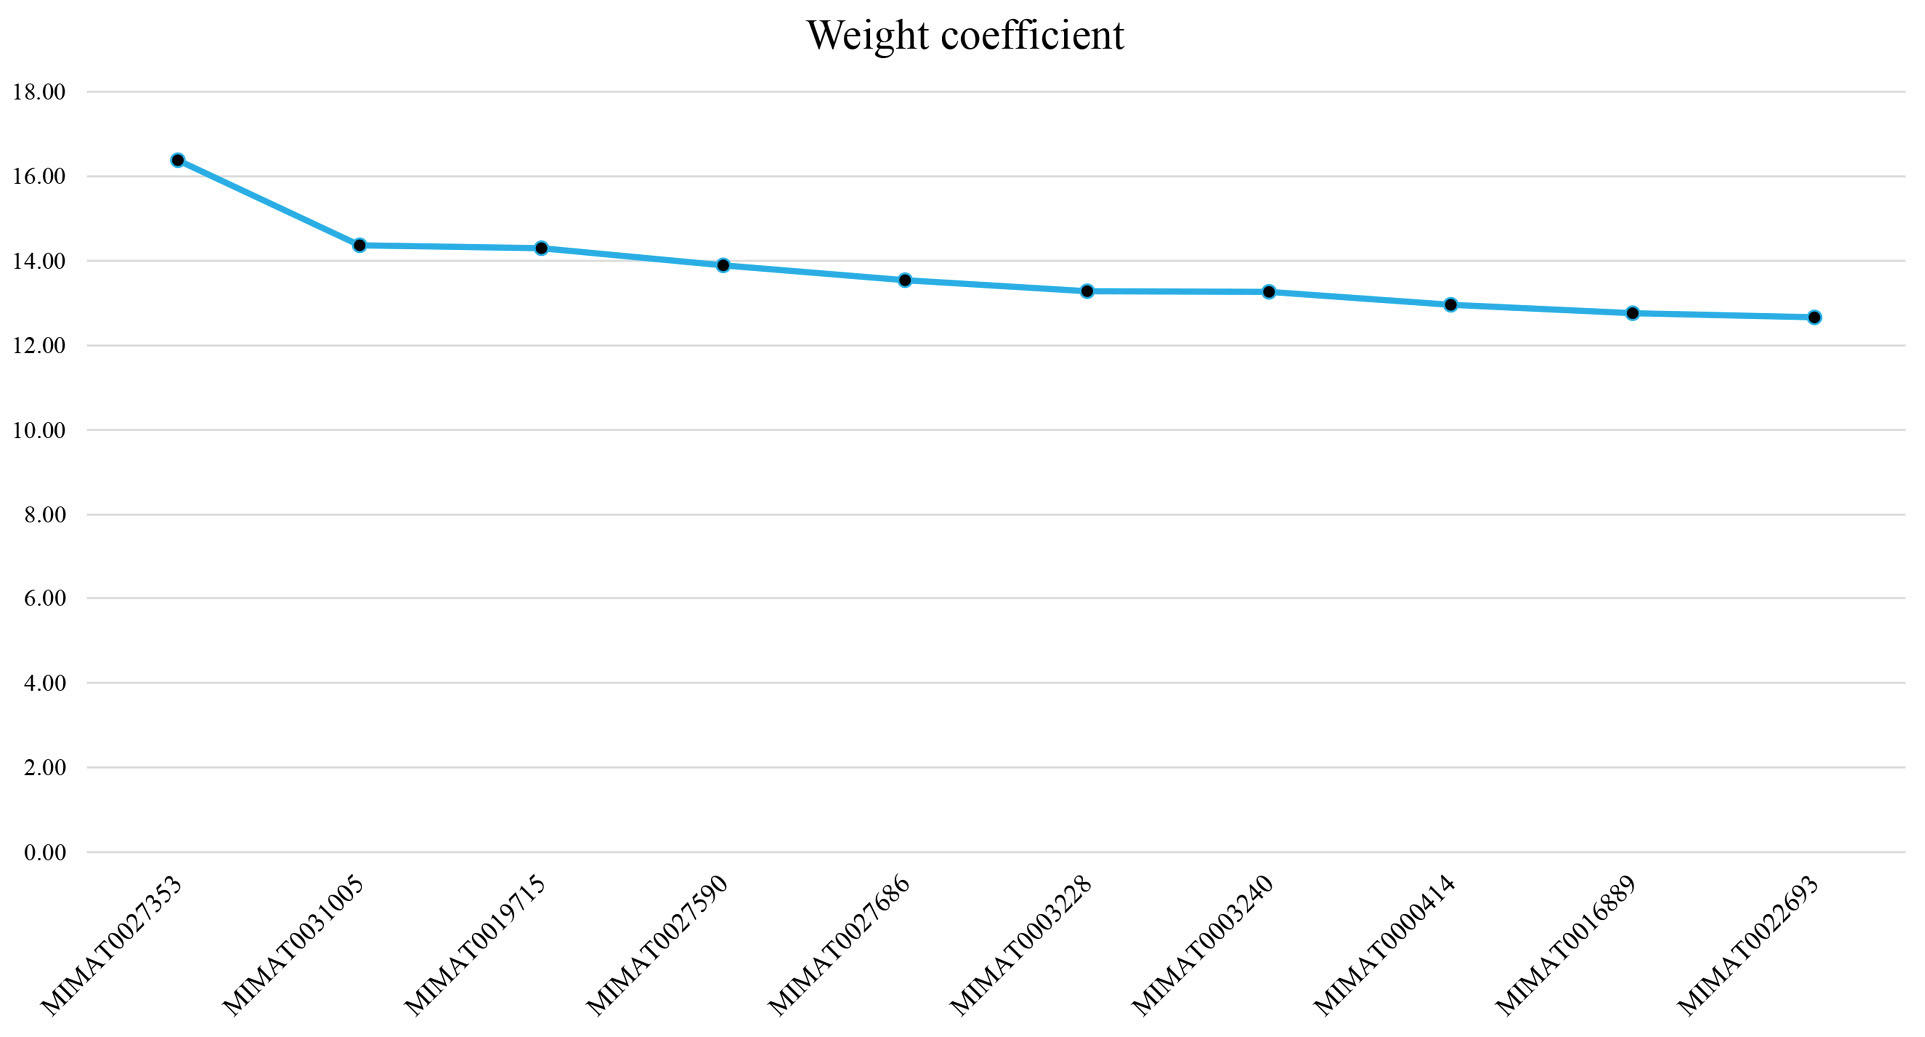
Figure 2.
A Total of 10 miRNAs in the Current Study With Considerable Coefficient Weight in the Primary SVM Model. Note. The x-axis corresponds to the miRNA ID. The y-axis represents the coefficient weight. SVM, support vector machine.
.
A Total of 10 miRNAs in the Current Study With Considerable Coefficient Weight in the Primary SVM Model. Note. The x-axis corresponds to the miRNA ID. The y-axis represents the coefficient weight. SVM, support vector machine.
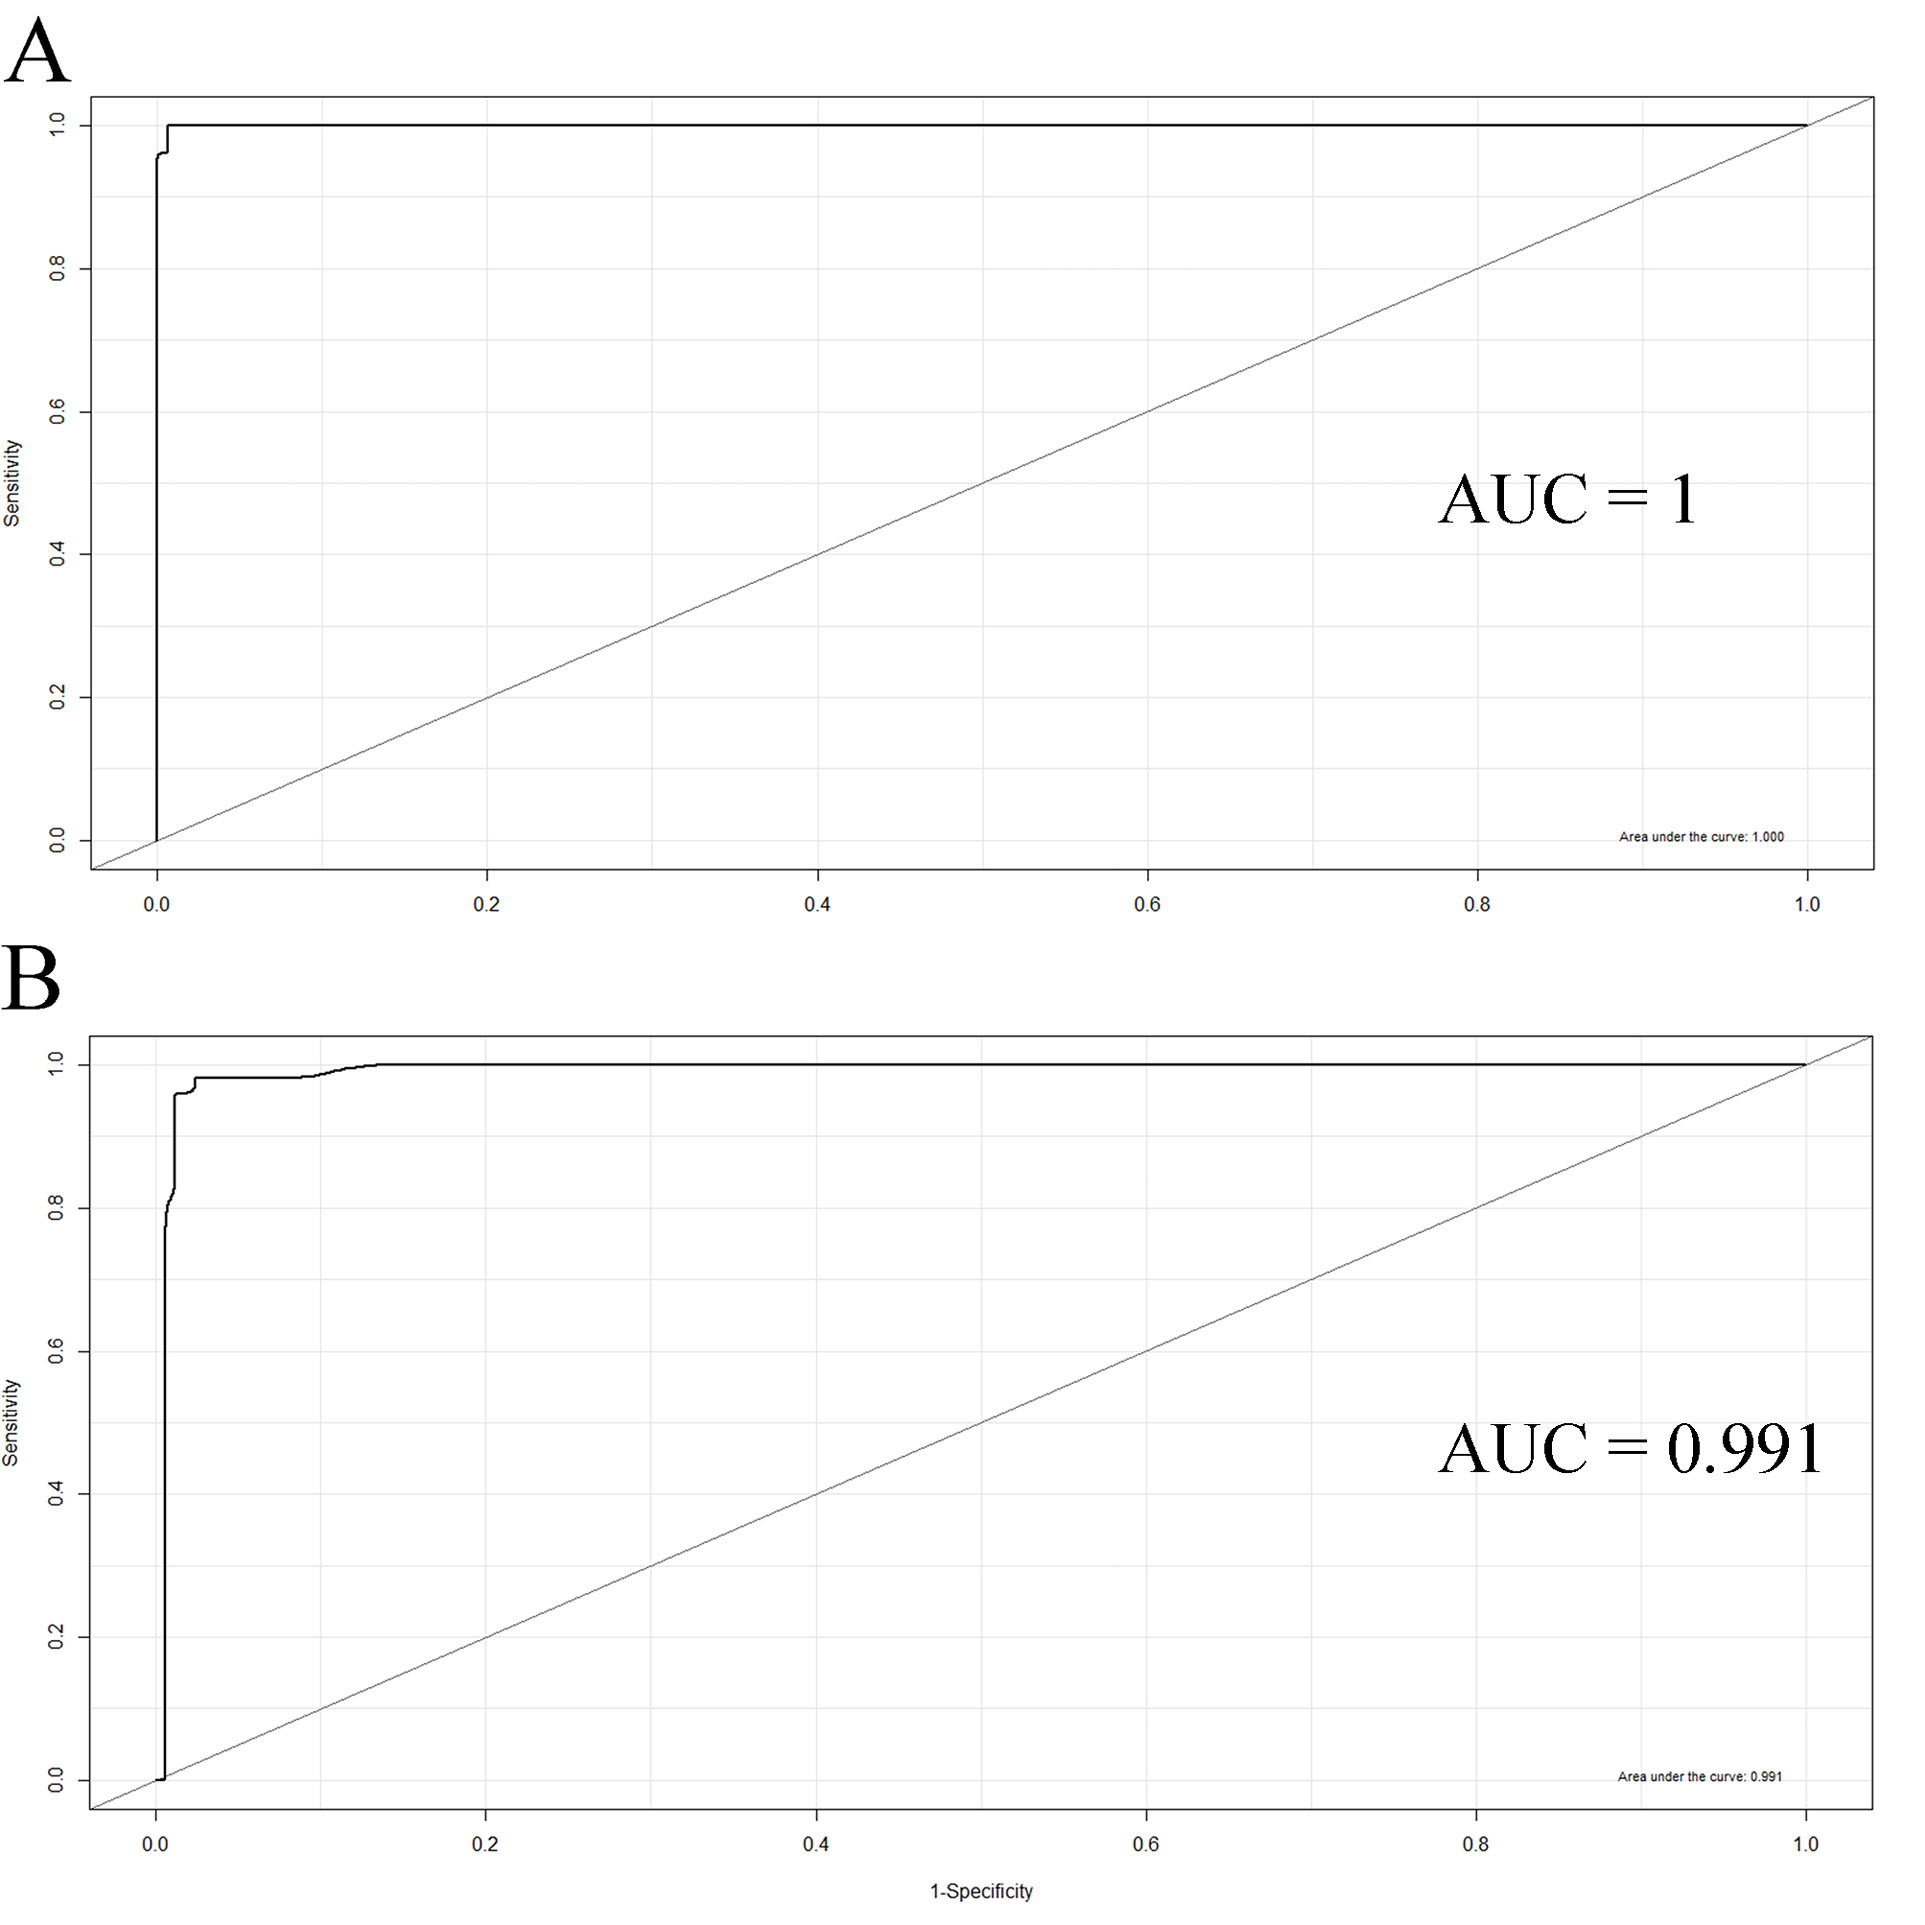
Figure 3.
ROC Analysis Performed for the Evaluation of Classifier Models Established With the SVM Algorithm. The area under the curves were 1 and 0.99, using the (A) 569 differentially expressed miRNAs, and (B) top three ranked differentially expressed miRNAs based on their weight coefficient, respectively. Note. ROC, receiver operating characteristic; SVM, support vector machine.
.
ROC Analysis Performed for the Evaluation of Classifier Models Established With the SVM Algorithm. The area under the curves were 1 and 0.99, using the (A) 569 differentially expressed miRNAs, and (B) top three ranked differentially expressed miRNAs based on their weight coefficient, respectively. Note. ROC, receiver operating characteristic; SVM, support vector machine.
Table 1.
Parameters of the Support Vector Machine Models
|
Type of Dataset
|
SVM-Type
|
SVM-Kernel
|
Cost
|
Gamma
|
Number of support Vectors
|
| Using 569 DEMs |
C-classification |
radial |
1 |
0.0017 |
71 |
| Using top three ranked features |
C-classification |
radial |
1 |
0.33 |
27 |
SVM, support vector machine; DEMs, differentially expressed miRNAs.
PPI Network and GSE Analyses
Bioinformatics analyses were performed using the miRWalk 2.0 database to predict DEMs-target interactions. Accordingly, a total of 10,745 unique genes were identified as validated target genes of the DEMs. In addition, the PPI network, which was based on the DEMs-targets, and associated with CRC, was constructed. The PPI network contained 396 998 interactions between 19 191 nodes. The MCODE plugin identified 91 clusters in the graph, 30 of which had seed nodes involved in the initial dataset (DEMs-targets). Accordingly, they were assumed as considerable modules in the PPI network. The characteristics of these 30 modules are demonstrated in Table 2. It should be noted that the nodes involved in a unique cluster usually participate in a common procedure, neither a BP nor a pathway (29,52). The BP and pathway enrichment analyses were performed using the ClueGO plugin and Reactome database (https://reactome.org/) (53), respectively, for the 30 critical clusters. According to the results, a total of 887 enriched pathways and 1005 BPs associated with CRC were identified. (Tables S3 and S4, respectively). In addition, a total of 9 MFs and 14 CCs were significantly affected in CRC. The list of enriched MFs and CCs are presented in Table 3 and Table 4, respectively. The network analyzer tool was utilized to identify proteins of potential importance to the CRC in the network. The average value of the degree, betweenness centrality, closeness centrality, and eccentricity for all the nodes in the network were calculated to be 41.37, 0.000111, 0.3214, and 5.72, respectively. A total of 110 proteins had a betweenness and degree higher than 2-fold the average, besides having a closeness and eccentricity greater than the mean of the nodes in the graph; accordingly, they were considered as hub nodes in the PPI network associated with CRC (Table S5).
Table 2.
Characteristics of the 30 Significant Modules in the Protein-Protein Interaction Network Associated With Colorectal Cancer
|
Cluster no.
|
Score
|
No. of nodes
|
No. of edges
|
Seed (protein ID)
|
Seed (gene ID)
|
Seed degree
|
| 1 |
226.07 |
401 |
45227 |
Q7Z340 |
ZNF551 |
400 |
| 2 |
85.44 |
91 |
4408 |
P62263 |
RPS14 |
296 |
| 3 |
74.49 |
124 |
4803 |
P84103 |
SRSF3 |
198 |
| 4 |
34.15 |
136 |
2469 |
P03372 |
ESR1 |
867 |
| 5 |
26.63 |
161 |
2242 |
Q9UJV9 |
DDX41 |
167 |
| 7 |
13.69 |
413 |
3004 |
Q8WXA9 |
SREK1 |
92 |
| 14 |
5.56 |
10 |
25 |
Q0IIN5 |
VCP |
15 |
| 25 |
3.50 |
206 |
414 |
Q9H496 |
TOIP2 |
71 |
| 29 |
3.39 |
143 |
296 |
Q02809 |
PLOD1 |
77 |
| 35 |
3.33 |
4 |
5 |
Q9P2N5 |
RBM27 |
40 |
| 38 |
3.24 |
30 |
59 |
O43525 |
KCNQ3 |
10 |
| 39 |
3.23 |
128 |
239 |
Q14188 |
TFDP2 |
22 |
| 45 |
3 |
3 |
3 |
P30511 |
HLAF |
26 |
| 48 |
3 |
3 |
5 |
Q9Y3A0 |
COQ4 |
16 |
| 50 |
3 |
3 |
3 |
P13164 |
IFITM1 |
10 |
| 54 |
3 |
3 |
5 |
Q4G0X4 |
KCTD21 |
13 |
| 55 |
3 |
3 |
3 |
Q9UMR3 |
TBX20 |
10 |
| 61 |
3 |
3 |
3 |
Q9NUS5 |
AP5S1 |
2 |
| 65 |
3 |
3 |
3 |
Q9NX76 |
CMTM6 |
19 |
| 69 |
2.8 |
6 |
7 |
Q96MV1 |
TLCD4 |
15 |
| 70 |
2.75 |
89 |
133 |
Q15477 |
SKIV2 |
31 |
| 71 |
2.75 |
60 |
87 |
Q9Y6D6 |
BIG1 |
32 |
| 75 |
2.67 |
4 |
5 |
Q14721 |
KCNB1 |
24 |
| 76 |
2.67 |
4 |
5 |
Q14206 |
RCAN2 |
21 |
| 77 |
2.67 |
4 |
4 |
Q58F15 |
EPHA4 |
8 |
| 80 |
2.67 |
4 |
4 |
Q4ZG77 |
PSMD14 |
3 |
| 81 |
2.67 |
4 |
4 |
Q5VVC8 |
RPL11 |
3 |
Table 3.
The Molecular Functions Analysis of DEMs-target Genes Associated With Colorectal Cancer
|
GO ID
|
GO Term
|
No. of Genes
|
Percent
|
| GO:0005215 |
Transporter activity |
513 |
6.40 |
| GO:0045182 |
Translation regulator activity |
27 |
0.30 |
| GO:0038024 |
Cargo receptor activity |
3 |
0.00 |
| GO:0140110 |
Transcription regulator activity |
610 |
7.60 |
| GO:0003824 |
Catalytic activity |
2652 |
33.00 |
| GO:0098772 |
Molecular function regulator |
491 |
6.10 |
| GO:0060089 |
Molecular transducer activity |
417 |
5.20 |
| GO:0005198 |
Structural molecule activity |
306 |
3.80 |
| GO:0005488 |
Binding |
3011 |
37.50 |
DEMs, differentially expressed miRNAs; GO, gene ontology.
Table 4.
The Cellular Component Analysis of DEMs-target Genes Associated With Colorectal Cancer
|
GO ID
|
GO Term
|
No. of genes
|
Percent
|
| GO:0044456 |
Synapse part |
106 |
0.50 |
| GO:0044425 |
Membrane part |
1034 |
4.90 |
| GO:0016020 |
Membrane |
1829 |
8.60 |
| GO:0045202 |
Synapse |
112 |
0.50 |
| GO:0044422 |
Organelle part |
1699 |
8.00 |
| GO:0044421 |
Extracellular region part |
311 |
1.50 |
| GO:0030054 |
Cell junction |
83 |
0.40 |
| GO:0031974 |
Membrane-enclosed lumen |
588 |
2.80 |
| GO:0032991 |
Protein-containing complex |
1677 |
7.90 |
| GO:0099080 |
Supramolecular complex |
180 |
0.90 |
| GO:0005576 |
Extracellular region |
311 |
1.50 |
| GO:0005623 |
Cell |
4899 |
23.20 |
| GO:0044464 |
Cell part |
4899 |
23.20 |
| GO:0043226 |
Organelle |
3430 |
16.20 |
DEMs, differentially expressed miRNAs; GO, gene ontology.
Master Regulators for the Hub Genes
The Cytoscape software with the iRegulon plugin was used to predict the TFs related to the hub genes. Only TFs with an NES > 3.0 were considered to be statistically significant (54). Accordingly, there were 22 convincing TFs associated with CRC. The most enriched TF motif was CCAAT/enhancer-binding protein delta (CEBPD) with an NES 3.96. Furthermore, a total of 45 hub genes were regulated by signal transducer and activator of transcription 1 (STAT1). The statistics of the significant master upstream regulators are presented in Table 5. In addition, the TF-associated GRNs were constructed and merged. This network contained 113 nodes and 398 edges (Figure 4).
Table 5.
A Total of 22Master Regulators Identified in the Gene Regulatory Network Associated With Colorectal Cancer
|
TF
|
NES
|
Degree
|
Targets
|
| CEBPD |
3.96 |
7 |
FLOT1, GMCL1, APOB, UBB, ARL6IP1, MAP1LC3B, CTSB |
| GATA3 |
3.82 |
20 |
PDE4DIP, MED23, FLOT1, GNAQ, ITSN1, SP3, PSMB2, SNX6, CTSB, USP2, PDK1, WT1, SNRPE, ERRFI1, FZR1, ECSIT, PLEC, ARL6IP1, ZNF526, JMJD6 |
| GATA5 |
3.68 |
8 |
NOS3, APOB, GNA14, WT1, HLA-C, CHRM3, ERRFI1, CHRM1 |
| CEBPB |
3.6 |
9 |
ANXA1, CTSB, TJP2, GMCL1, SNRPE, PDE4DIP, PLEC, ERRFI1, FLOT1 |
| PLAG1 |
3.57 |
22 |
GLP1R, USP2, RAB8A, CBX6, ECSIT, TFAP4, GNAQ, HLA-C, GMCL1, TJP2, CHRM1, MAPK8IP2, PEX5, CHRM3, CTNNA3, GNGT1, PLEC, ERRFI1, APOB, MMP9, TSC22D4, OTX1 |
| STAT3 |
3.52 |
18 |
GNAQ, MYB, ANXA1, LNX2, LYBD3, PLAUR, MAP1LC3B, SAV1, AGTRAP, TSC22D4, SP3, RAD23A, PRNP, TJP2, FLOT1, CBX6, UBB, CTSB |
| HIVEP1 |
3.36 |
7 |
CREB3, RAB10, PDE4DIP, HLA-C, APOB, CHRM1, GMCL1 |
| HSF1 |
3.26 |
7 |
ERRFI1, SKIL, HLA-C, FKBP4, ATP6V1B1, GNAQ, CACNA1A |
| EGR1 |
3.25 |
21 |
SKIL, CHRM1, TSC22D4, MMP9, CACNA1A, EPS15, GLP1R, ODF2, FZR1, ERRFI1, PDE4DIP, ECSIT, HLA-C, PLEC, ITSN1, WT1, SUV39H1, MYB1, CTSB, UPS2, MTNR1A |
| NF1 |
3.24 |
40 |
FKBP4, USP2, SRSF3, CHRM1, PSMB2, GNB5, SUV39H1, RAB10, KRT31, TSC22D4, ERRFI1, CDK8, CTDSPL, GNAQ, CTNNA3, MTNR1B, GNG5, VKOR, C1, SLX4, PRNP, MMP9, CTSB, SKIL, GLP1R, MED23, CBX6, WT1, PDE4DIP, |
| MYF6 |
3.23 |
39 |
TFAP4, TSC22D4, HLA-C, SLAMF1, SRSF3, MED23, GNA14, TAZ, PEX5, MED21, ECSIT, ERRFI1, PIP4K2A, CDK15, EPS15, CACNA1A, ANXA1, CHRM1, APOB, GLP1R, CTNNA3, ITSN1, RAB8A, KRT31, CBX6, GNAQ, PSMB5, |
| FOXC1 |
3.21 |
33 |
CHRM1, SP3, SRSF3, RAB10, CBX6, HLA-C, PSMB5, ECSIT, UBB, CACNAA1A, MMP9, ANXA1, USP2, TAZ, GLP1R, GNAQ, ERRFI1, MYB, MTNR1B, CTNNA3, PLEC, CTSB, ITCH, TTC1, GNB5, ITSN1, NOS3, SKIL, PIP4K2A, TFAP4 |
| ELF5 |
3.19 |
33 |
A2M, MMP9, SNRPE, PDE4DIP, TJP2, CDIPT, ITSN1, GNGT1, CHRM1, GNB5, HLA-C, FKBP4, ERRFI1, AGTRAP, GNG5,CACNA1A, GNAQ, TSC22D4, SP3, SKIL, NOS3, ANXA1, USP2, CREB3, SAV1, TLR4, PIP4K2A, SLAMF1, WT1, MED23, ODF2, CTSB, KRT31 |
| SIX4 |
3.16 |
17 |
MMP2, PLEC, KRT31, ECSIT, PRNP, CTSB, PDE4DIP, GNAQ, GLP1R, ANXA1, NOS3, TLR4, PLAUR, HLA-C, TJP2, CHRM1, MMP9 |
| MECOM |
3.14 |
9 |
SKIL, CTNNA3, USP2, MED23, GNAQ, PDE4DIP, MTNR1A, MTNR1B, MYB |
| UGP2 |
3.12 |
7 |
ATP6V1B1, USP2, CHRM1, PLEC, FZR1, TFAP4, CTSB |
| KAT2A |
3.11 |
13 |
PDE4DIP, ITCH, PARP2, JMJD6, SAV1, SRSF3, SLAMF1, ERRFI1, CBX6, ZNF526, PSMB5, SYVN1, MED21 |
| STAT1 |
3.1 |
45 |
CHMP4B, CACNA1A, CTNNA3, ODF2, GMCL1, PDE4DIPM ITCH, PSMC2, SNX6, EPS15, SNRPE, TSC22D4, PIP4K2A, HLA-C, TFAP4, WT1, SKIL, ERRFI1, ANX, A1, CTSB, MAP1LC3B, MYB, ARL6IP1, NOS3, CHRM1, UBE2L3, TTC1, GNAQ, TJP2, ITSN1, SP3, CDK15, RAB8A, USHBP1, LYPD3, PSMB5, SRSF3, ECSIT, FZR1, GNG5, PLEC, MMP9, USP2, RAB10, DDX46 |
| MSI2 |
3.05 |
6 |
HLA-C, TFAP4, CTNNA3, GNAQ, SRSF3, ANXA1 |
| SIN3A |
3.05 |
10 |
UBQLN4, MAPK8IP2, STX4, AGTRAP, CCHCR1, SYVN1, CREB3, TFAP4, ECSIT, PDEADIP |
| FOXD1 |
3.03 |
21 |
PLEC, CBX6, TFAP4, MED21, PDE4DIP, GNAQ, ANXA1, CACNA1A, MYB, CTSB, MMP2, SYVN1, CTNNA3, HLA-C, USP2, TJP2, MTNR1A, CHRM1, CHMP4B, SP3, PDK1 |
| NR3C1 |
3.02 |
6 |
MTNR1A, USP2, SAV1, MED23, PLEC, GNAQ |
TF, transcription factor; NES, normalized enrichment score.
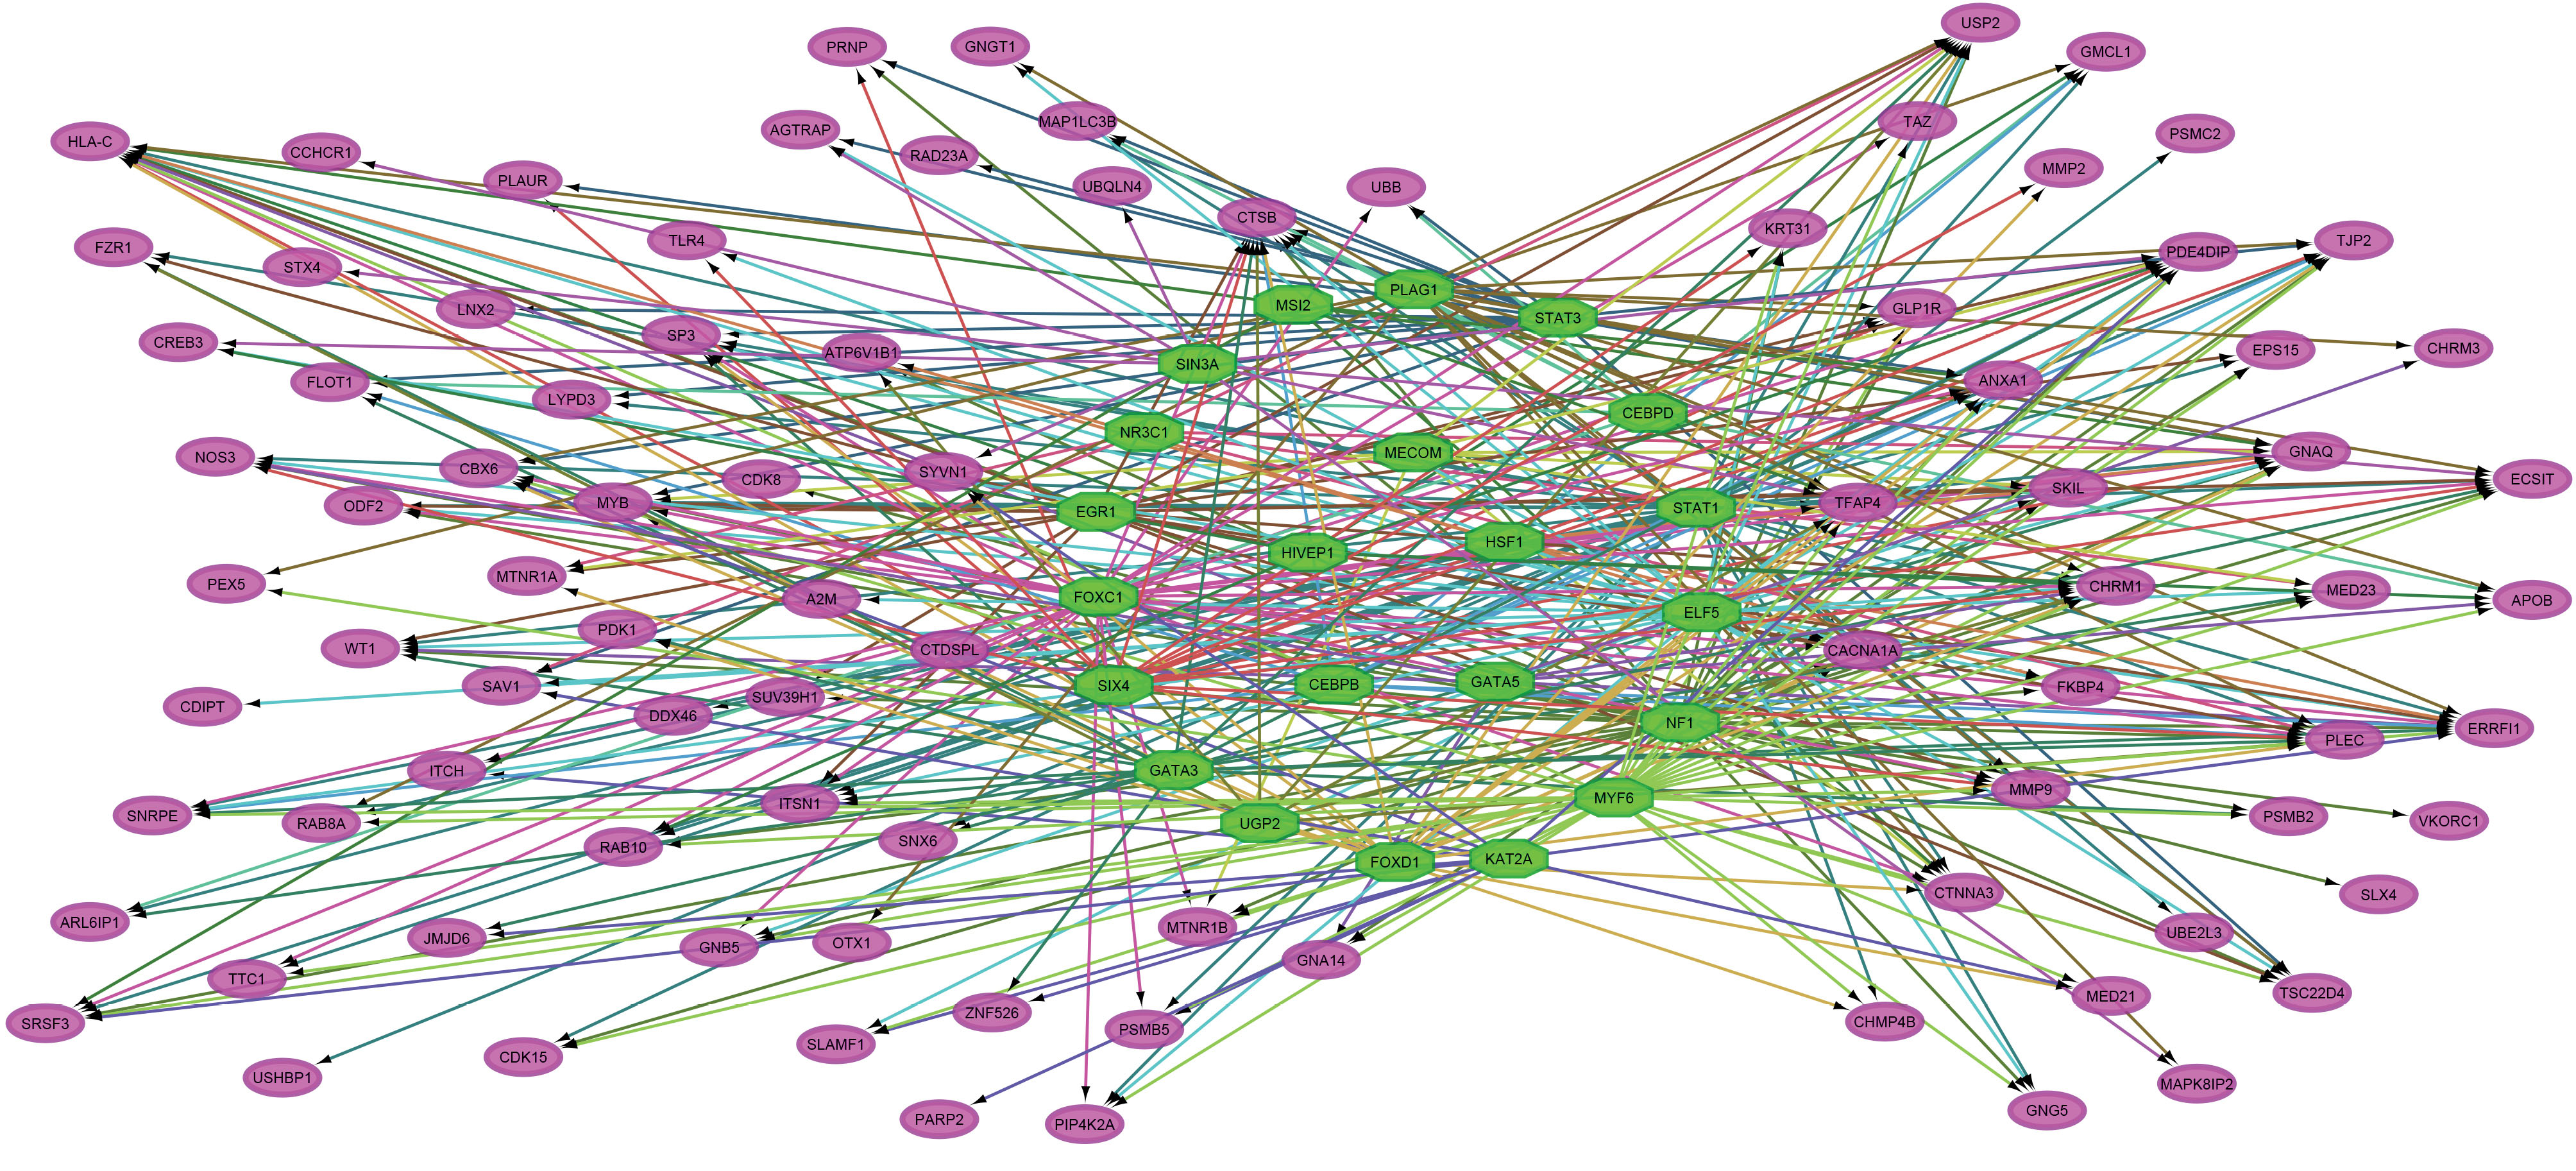
Figure 4.
Gene Regulatory Network. The green octagons represent transcription factors, and the pink elliptical nodes indicate the target hub genes in the protein-protein interaction network associated with CRC. Note. CRC, colorectal cancer.
.
Gene Regulatory Network. The green octagons represent transcription factors, and the pink elliptical nodes indicate the target hub genes in the protein-protein interaction network associated with CRC. Note. CRC, colorectal cancer.
Discussion
In the present study, the serum miRNA expression profiles from patients with CRC and healthy individuals were obtained from the GEO database and analyzed. According to the results, a total of 569 miRNAs were found to be statistically significant in the two groups using a multivariate OPLS analysis (P < 0.001). Furthermore, two SVM classifiers were designed using DEMs and the top three ranked miRNAs based on their weight coefficient in the primary model; the models distinguished CRC from those with healthy individuals over the 100 times repeat of LOO cross-validations with an AUC of 1 and 0.99, respectively. The established SVM classifiers demonstrated great potential for the future invention of a serum-based diagnostic test for CRC. Although the final SVM classifier we developed in this study was not as robust as the primary model, the biomarker signature for the second model contained only three miRNAs; this makes the diagnostic approach to be less time-consuming and costly. After identifying the DEMs-targets, a PPI network associated with CRC was built and analyzed using the MCODE, ClueGO, and network analyzer tool in the Cytoscape software, besides the Reactome database. Accordingly, there were 1005 BPs and 887 pathways significantly enriched in our study by Bonferroni correction for multiple comparisons (FDR < 0.05). The GO analysis also revealed that 9 MFs and 14 CCs were significantly affected in CRC by univariate Wilcoxon Rank-Sum Test with Bonferroni correction utilizing the PANTHER database (FDR < 0.05). In addition, we identified a total of 110 critical proteins, which play essential roles in the PPI network associated with CRC. Furthermore, GRN analysis was performed to verify the TFs involved in the regulation of the hub proteins in the PPI network, using the iRegulon plugin in the Cytoscape.
Reactome pathway analysis demonstrated that the genes involved in the most significant clusters in the PPI network were primarily associated with the “Regulation of activated PAK-2p34 by proteasome mediated degradation”, “FBXL7 down-regulates AURKA during mitotic entry and in early mitosis”, and “SCF-beta-TrCP mediated degradation of Emi1” (Figure 5).
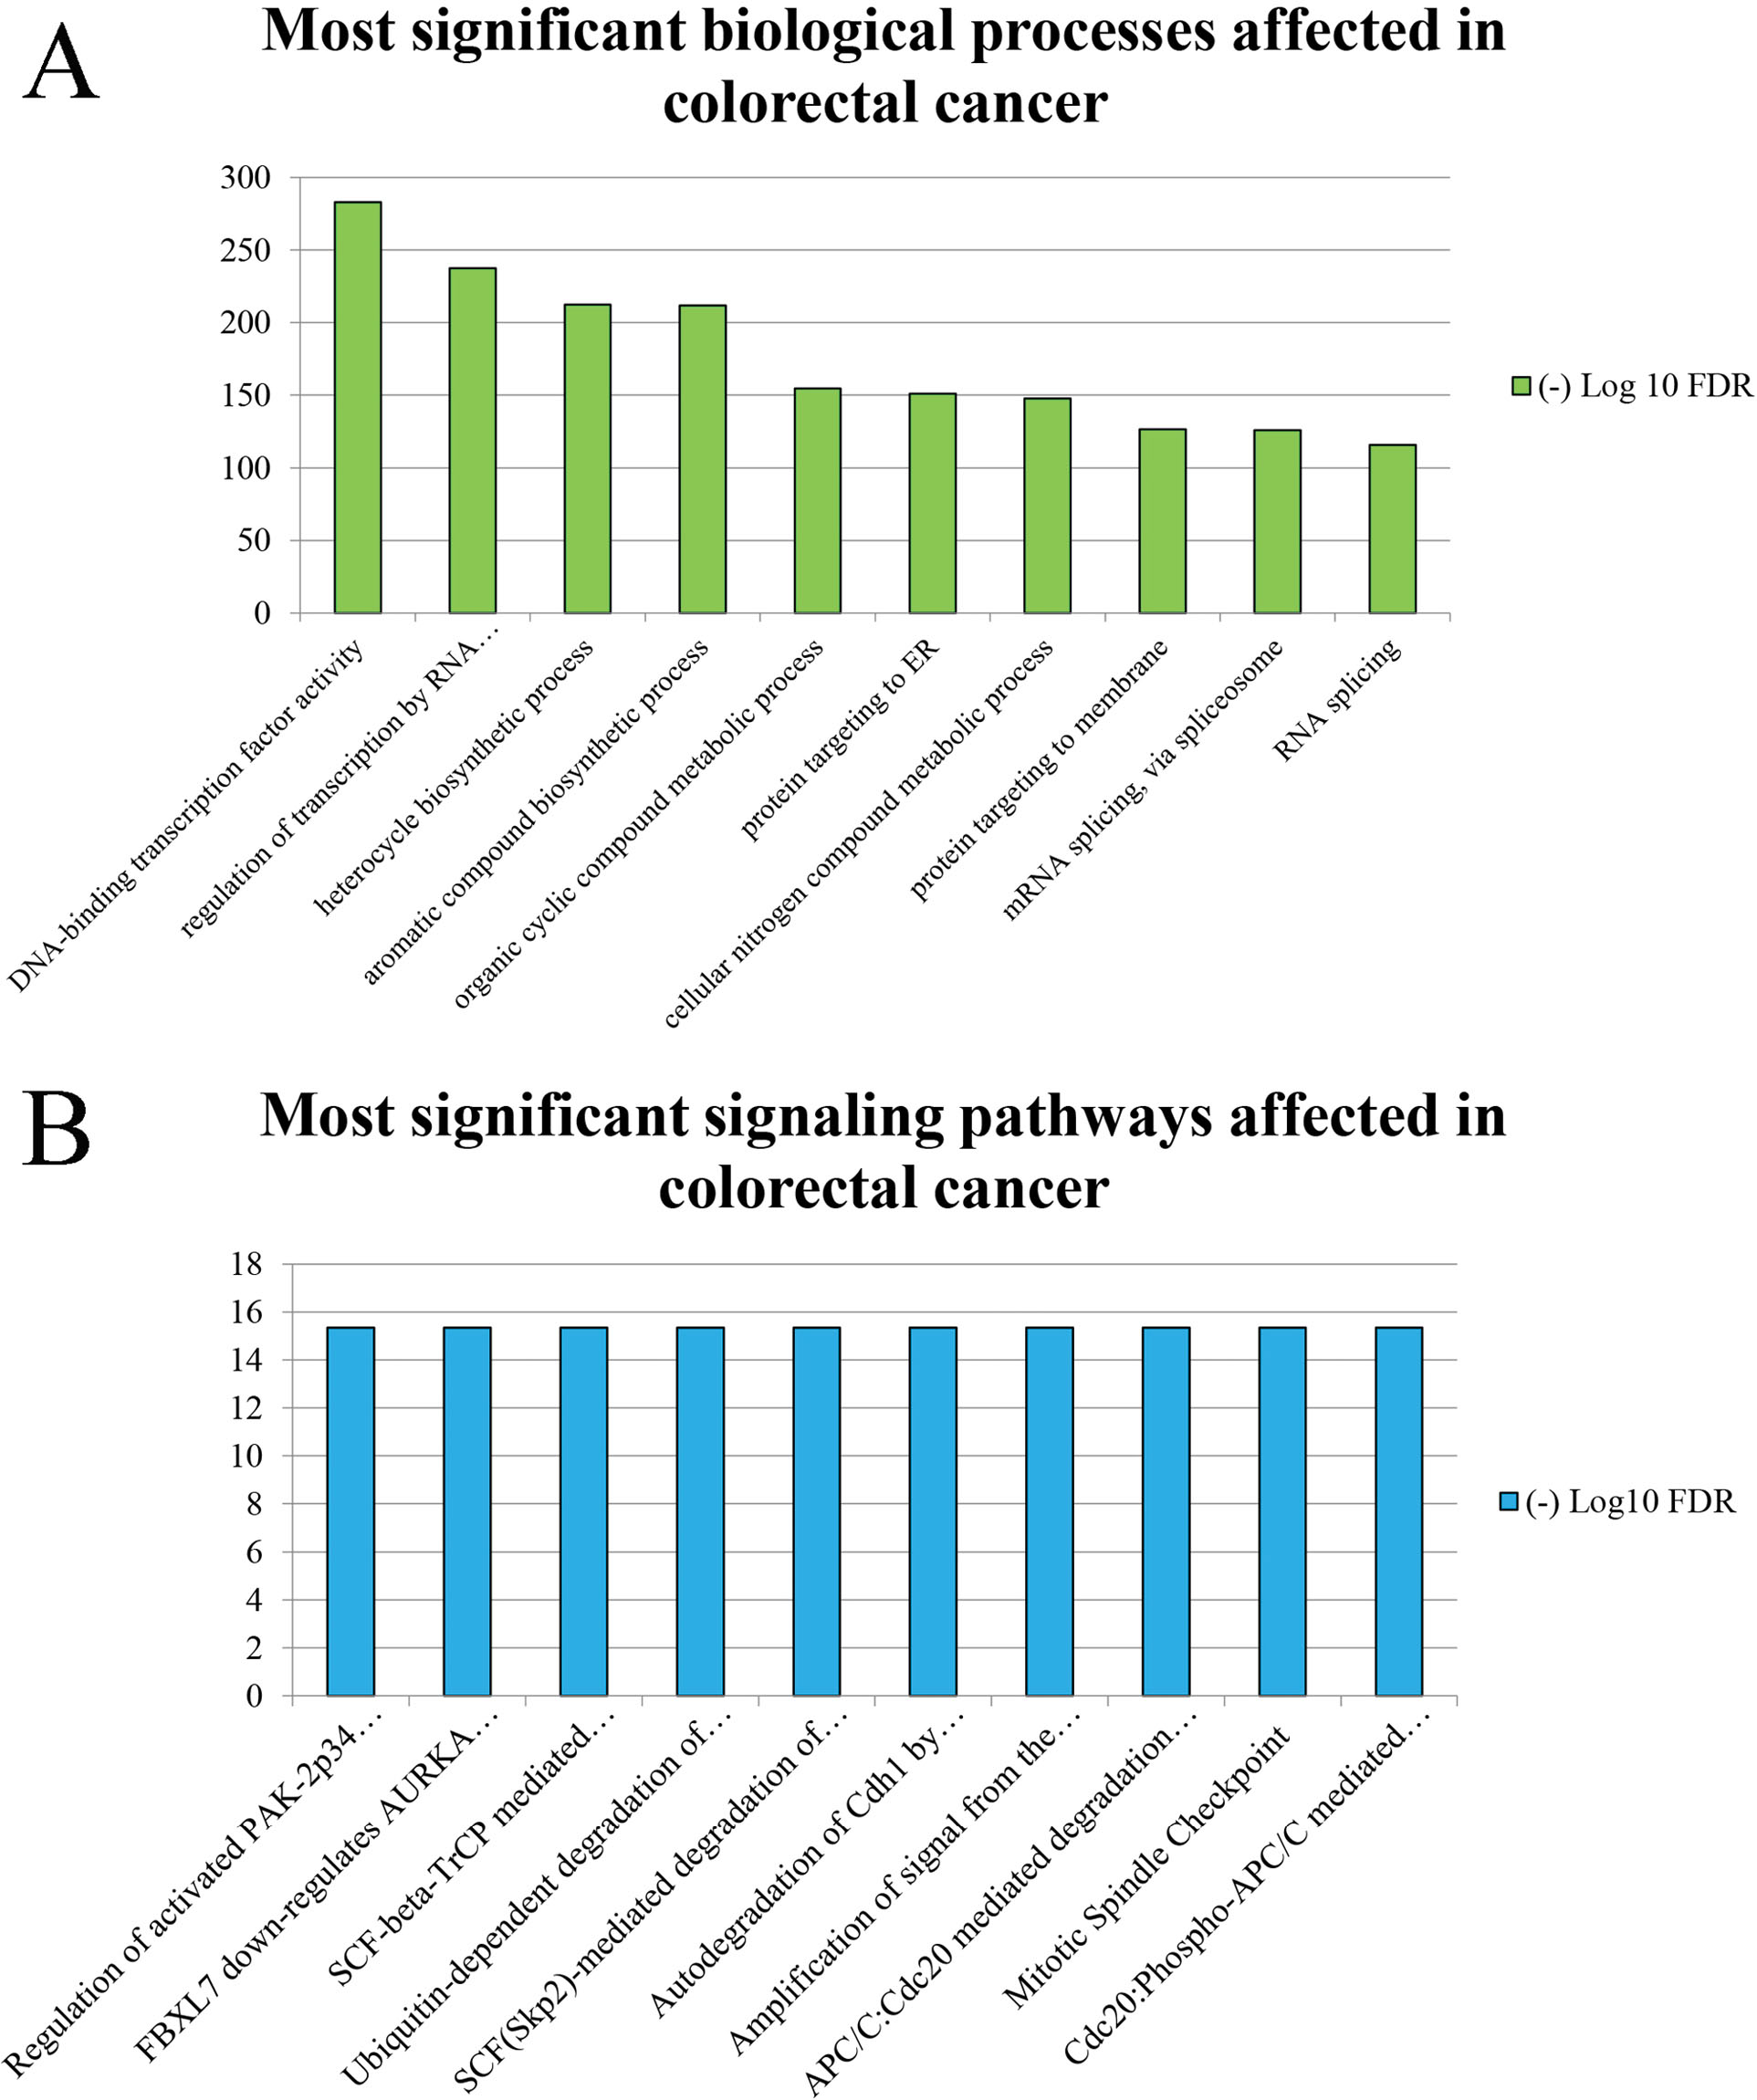
Figure 5.
Most Significant (A) Biological Processes and (B) Signaling Pathways Affected in CRC. The x-axis represents the name of the term. The y-axis corresponds to the – Log 10 of FDR. Note. CRC, colorectal cancer; FDR, false discovery rate.
.
Most Significant (A) Biological Processes and (B) Signaling Pathways Affected in CRC. The x-axis represents the name of the term. The y-axis corresponds to the – Log 10 of FDR. Note. CRC, colorectal cancer; FDR, false discovery rate.
It is well-known that coordinated regulation of proliferation, cell survival, and apoptosis play an essential role in the progress and maintenance of multicellular organisms. The p21-activated protein kinases (PAKs) are implicated in cell survival and cell death (55,56). The p21-activated protein kinase 2 (PAK-2) can act as an anti- and pro-apoptotic factor depending on its mechanism of activation. Accordingly, full-length activation of PAK-2 via the monomeric GTPases Cdc42 or Rac promotes cell survival. However, caspase activation of PAK-2 to the PAK-2p34 fragment contributes to the apoptotic response and therefore, under-expression of caspase-activated PAK-2p34 may result in neoplastic growth (57). Lee et al (58) demonstrated that recombinant expression of PAK-2p34 induced morphological changes characteristic of apoptotic cell death in different types of cell lines and promoted cell death in HeLa and CHO cells. In addition, Jakobi et al (59) showed that the concentration of caspase-activated PAK-2p34 is regulated by ubiquitination and degradation by the proteasome.
Aurora kinase A (AURKA) is a mitotic serine/threonine kinase that plays a role in the regulation of cell cycle progression (60). AURKA is associated with the centrosome and the spindle microtubules during mitosis; therefore, it plays an important role in different mitotic events such as the establishment of mitotic spindle, centrosome duplication, centrosome separation, maturation, chromosomal alignment, spindle assembly checkpoint, and cytokinesis (60,61). According to previous studies, overexpression of AURKA contributes to mitotic disturbance and neoplastic progression (62-64). Controversial roles have been reported for AURKA; activation and/or overexpression of AURKA were demonstrated in early-stage/low-grade, as well as noninvasive ovarian tumors, suggesting that its aberrant expression could be considered as an early event in ovarian oncogenesis (65). In addition, low-grade patients illustrated higher AURKA expression than high-grade patients in CRC (66). Moreover, overexpression of AURKA was associated with favorable prognosis in patients with metastatic CRC (67). Therefore, the exact roles of AURKA in tumorigenesis of CRC deserve further study (68).
Early mitotic inhibitor 1 (Emi1) is an inhibitor of ubiquitin ligase–anaphase promoting complex/cyclosome (APC/C) during mitotic and meiotic cell cycle (61,69), resulting in the accumulation of cyclins A and B, as a consequence, preventing re-replication during the S phase (70). It has been reported that depletion of Emi1 promotes DNA re-replication (71). Chao et al (72) determined the effects of inhibiting the expression of thymosin β4 (Tβ4) on normal intestinal epithelial cells. It is noteworthy that Tβ4 is one of the proteins considered as a target for treatment of CRC. Chao et al (72) demonstrated that reduced expression of Tβ4 in IEC-6 normal rat small intestinal cells diminished the growth, which is associated with DNA re-replication caused by decreased expression of Emi1, its upstream activator, and transcription factor E2F1.
The PPI network analysis revealed that a total of 110 hub genes were considerably associated with the pathogenesis of CRC. Accordingly, PDK1, SNRPE, and GNB5 demonstrated the highest degree of scores in the graph.
Pyruvate dehydrogenase kinase 1 (PDK1) is one of the most important enzymes in the glycolysis pathway contributes to a switch in metabolism from mitochondria-based glucoseoxidation to cytoplasm-based glycolysis. Several studies have demonstrated that PDK1 was upregulated in various solid tumors and hematological malignancies, including ovarian cancer, head and neck cancer,glioma, melanoma, and acute myeloid leukemia (73-77). Quin et al (78) demonstrated that overexpression of PDK1 was significantly associated with poor prognosis in CRC patients, and PDK1 knockdown resulted in reduced liver metastasis in both nude mice and immune competent mice. Quin et al (78) concluded that PDK1 inhibition diminishes the survival of CRC cells in blood circulation through overexpression of anoikis.
Small nuclear ribonucleoprotein E is encoded by the SNRPE gene, and is involved in the core component of U small nuclear ribonucleoproteins, which are implicated in the pre-mRNA processing spliceosome. In addition, the encoded protein contributes to the 3’ end processing of histone transcripts. This protein has been considered as one of the targets in many human disorders, such as autoimmune disease systemic lupus erythematosus, and previous studies have linked between mutations in this gene and hypotrichosis (79-83). Anchi et al (84) demonstrated that SNRPE is upregulated in high-grade prostate cancer (PC) cells comparedwith normal prostatic epithelial cells. This was done by using qRT-PCR. In addition, knockdown of SNRPE expression by short interfering RNA (siRNA) led to the suppression of proliferation in PC cells. Anchi et al (84) suggested that SNRPE may be considered as new target for therapeutic aims of PC. However, the exact mechanism of SNRPE in thedevelopment of CRC remains unknown and needs further study in the future.
Guanine nucleotide‐binding protein subunit beta‐5 (Gβ5) is encoded by the GNB5 gene (85). Gβ5 interacts with G‐protein–coupled receptors leading to downregulation of central nervous system G‐protein signaling pathway, and therefore, participates in several BPs including neurotransmission (86). It has been reported that GNB5knockout in mice resulted in impairedneurologic, cardiac, and retinal function (87). Park et al (88) analyzedthe gene expression data of CRC patients treated with cetuximab (CTX) monotherapy. The authors demonstrated a significant correlation between GNB5 overexpression and poorprognosis in patients with CRC. In addition, GNB5 knockdown increased CTX sensitivity; therefore, the authors suggested that GNB5 may be considered as a potential target to combat CTX resistance. Moreover, Park et al (88) reported that upregulation of GNB5leads to CTX resistance by modulating the Akt signaling pathway.
According to the results of the present study, several TFs were identified to act as a regulator of the hub genes in the PPI network, including STAT1 and CEBPD.
STAT1 was demonstrated to regulate the expression of 45 of the hub genes utilizing the iRegulon plugin in Cytoscape software. Tanaka et al (89) studied the alteration in STAT1 in 736 CRC tissue specimens, including 614 early stage and 122 advanced-stage patients. This was done using the immunohistochemistry technique and semi-quantitatively scoring. It was demonstrated that the overexpression of STAT1 in the cytoplasm of early-stage cases was significantly correlated with lower survival time in the microsatellite instability (MSI) subtype of CRCs. The authors suggested that STAT1 could be considered as a potential prognostic and diagnostic biomarker for early-stage MSI CRC. STAT1 is a master regulator for IFN-related intracellular signaling pathway and could be activated by several ligands in the cytoplasm, including interferon-alpha (IFN-α), IFN-γ, epidermal growth factor, platelet-derived growth factor, and interleukin 6. It has been reported that STAT1 plays multi-functional roles in the molecular biology of cancer. STAT1 can act as an anti-oncogenic molecule by overexpression of caspases (89-91), and down-regulation of the BCL2 family (89,92). In addition, it can act as a pro-oncogenic molecule in invasive breast carcinoma (89,93). Therefore, the exact mechanisms of STAT1 in CRC have not been fully elucidated (89) and needs consideration in future studies. However, according to the results of the study by Tanaka et al (89), a positive correlation was reported between the expression of STAT1, CD274, and PDCD1 in MSI CRCs. The authors speculated that the up-regulation of STAT1 might induce CD274 overexpression, which results in an immunosuppressive microenvironment. Thus, they suggested that STAT1 may act as a pro-oncogenic factor in MSI CRC patients.
CEBPD was the most enriched TF with an NES 3.96. This protein significantly regulated 9 of the hub proteins in the PPI network, including ANXA1, cathepsin B (CTSB), tight junction protein ZO-2 (TJP2), germ cell-less protein-like 1 (GMCL1), small nuclear ribonucleoprotein E (SNRPE), phosphodiesterase 4D-interacting protein (PDE4DIP), plectin (PLEC), ERBB receptor feedback inhibitor 1 (ERRFI1), and flotillin-1 (FLOT1). It has been reported that CEBPD is a critical tumor suppressor factor, and the down-regulation of the protein was demonstrated in different types of malignancies, including breast, liver, and cervical cancer (94,95). In addition, CEBPD elevates DNA stability in the hole genome (94,96). However, further research is required to examine the CEBPD expression in CRC.
The present study had some limitations. The miRNAs profiled in our study were generated from GPL18941 platform (3D-Gene Human miRNA V20_1.0.0), which probably only represents part of the miRNA populations. Therefore, the DEMs identified in this study may not represent all the DEMs in CRC. In addition, our results were only based on bioinformatics techniques. Thus, considerable in vitro and in vivo approaches are required to confirm these findings. Future studiesshould use more microarray datasets (e.g., gene microarray data sets) and compare the results with our findings. Besides, wet-lab approaches using large targeted cohorts are required to confirm these findings.
Conclusion
In conclusion, since miRNA has remarkable stability in the serum, it is considered as a possible biomarker for developing a non-invasive diagnostic approach for CRC detection. Accordingly, accurate prognostic models were developed using distinguishing miRNAs derived from the multivariate statistical analysis and their weight coefficient in the primary SVM model. In addition, PPI analysis revealed 30 clusters with considerable seed nodes, which were previously identified as DEMs-targets and were associated with CRC. The GSE analysis revealed 1,005 BPs, besides 887 pathways significantly affected in CRC. Investigating these BPs and pathways may elucidate the mechanism of CRC progression. PPI analysis identified 110 nodes considered to be the most important genes associated with CRC according to their remarkable degree, betweenness, closeness centrality, and eccentricity. The GRN analysis significantly demonstrated 22 TFs for the 110 hub genes. Accordingly, these selected hub genes and their master regulators may be considered as potential therapeutic targets for treating CRC. However, further molecular experiments are required to confirm the exact function of these identified genes in CRC. The DEMs-target genes significantly affected 9 MFs and 14 CCs in CRC patients. In addition to the results of the present study, the SVM classifier can successfully distinguish miRNA profiles in patients with CRC and healthy individuals. OPLS analysis is also a robust statistical technique, which can significantly identify DEMs derived from microarray data. The results of the present study provided insights into the molecular mechanism of CRC, which may be useful in further investigations and be used to establish novel and non-invasive diagnostic tests. However, validation is required in the future.
Authors’ Contributions
AT and MS designed the study. The statistical analysis was conducted by AT and MS. The SVM was built by AT and MS. The network and GO analysis was conducted and interpreted by AT and MS, and the results were analyzed and discussed by AT, MS and SA. AT wrote the manuscript. All authors read and approved the final version of the manuscript.
Conflict of Interest Disclosures
The authors declare that they have no conflict of interests.
Ethics Issues
The present study was approved by the Ethics Committee of Hamadan University of Medical Sciences, Hamadan, Iran (ethics no. IR.UMSHA.REC.1398.407).
Acknowledgments
The authors would like to appreciate the Deputy of Research and Technology, and Research Center for Molecular Medicine, Hamadan University of Medical Sciences, Hamadan - Iran, for their supports.
Funding
This research received no specific grant from any funding agency in the public, commercial, or not-for-profit sectors.
Availability of Data and Materials
The datasets used and/or analyzed during the current study are available from the corresponding author on reasonable request.
Supplementary Materials
Supplementary file 1 contains Tables S1-S5.
(pdf)
References
- The global, regional, and national burden of colorectal cancer and its attributable risk factors in 195 countries and territories, 1990-2017: a systematic analysis for the Global Burden of Disease Study 2017. Lancet Gastroenterol Hepatol 2019; 4(12):913-33. doi: 10.1016/s2468-1253(19)30345-0 [Crossref] [ Google Scholar]
- Shi M, Beauchamp RD, Zhang B. A network-based gene expression signature informs prognosis and treatment for colorectal cancer patients. PLoS One 2012; 7(7):e41292. doi: 10.1371/journal.pone.0041292 [Crossref] [ Google Scholar]
- Zhang L, Zhang Y, Zhao Y, Wang Y, Ding H, Xue S. Circulating miRNAs as biomarkers for early diagnosis of coronary artery disease. Expert Opin Ther Pat 2018; 28(8):591-601. doi: 10.1080/13543776.2018.1503650 [Crossref] [ Google Scholar]
- Liu GZ, Chen C, Kong N, Tian R, Li YY, Li Z. Identification of potential miRNA biomarkers for traumatic osteonecrosis of femoral head. J Cell Physiol 2020; 235(11):8129-40. doi: 10.1002/jcp.29467 [Crossref] [ Google Scholar]
- Chen W, Zheng R, Baade PD, Zhang S, Zeng H, Bray F. Cancer statistics in China, 2015. CA Cancer J Clin 2016; 66(2):115-32. doi: 10.3322/caac.21338 [Crossref] [ Google Scholar]
- Miller KD, Siegel RL, Lin CC, Mariotto AB, Kramer JL, Rowland JH. Cancer treatment and survivorship statistics, 2016. CA Cancer J Clin 2016; 66(4):271-89. doi: 10.3322/caac.21349 [Crossref] [ Google Scholar]
- De Rosa M, Pace U, Rega D, Costabile V, Duraturo F, Izzo P. Genetics, diagnosis and management of colorectal cancer (Review). Oncol Rep 2015; 34(3):1087-96. doi: 10.3892/or.2015.4108 [Crossref] [ Google Scholar]
- Johnson DA, Barclay RL, Mergener K, Weiss G, König T, Beck J. Plasma septin9 versus fecal immunochemical testing for colorectal cancer screening: a prospective multicenter study. PLoS One 2014; 9(6):e98238. doi: 10.1371/journal.pone.0098238 [Crossref] [ Google Scholar]
- Imperiale TF, Ransohoff DF, Itzkowitz SH, Levin TR, Lavin P, Lidgard GP. Multitarget stool DNA testing for colorectal-cancer screening. N Engl J Med 2014; 370(14):1287-97. doi: 10.1056/NEJMoa1311194 [Crossref] [ Google Scholar]
- deVos T, Tetzner R, Model F, Weiss G, Schuster M, Distler J. T2026 circulating methylated septin 9 DNA in plasma is a biomarker for colorectal cancer. Gastroenterology 2009; 136(5 Suppl 1):A-623. doi: 10.1016/s0016-5085(09)62872-9 [Crossref] [ Google Scholar]
- Kasztelan-Szczerbińska B, Cichoz-Lach H, Słomka M. Colorectal cancer as a health care problem: evaluation of the current diagnostic options. Pol Arch Med Wewn 2008; 118(4):224-7. [ Google Scholar]
- Ahlquist DA, Taylor WR, Mahoney DW, Zou H, Domanico M, Thibodeau SN. The stool DNA test is more accurate than the plasma septin 9 test in detecting colorectal neoplasia. Clin Gastroenterol Hepatol 2012; 10(3):272-7. doi: 10.1016/j.cgh.2011.10.008 [Crossref] [ Google Scholar]
- Zullig LL, Smith VA, Jackson GL, Danus S, Schnell M, Lindquist J. Colorectal cancer statistics from the veterans affairs central cancer registry. Clin Colorectal Cancer 2016; 15(4):e199-e204. doi: 10.1016/j.clcc.2016.04.005 [Crossref] [ Google Scholar]
- Tang L, Zhou L, Wu S, Shi X, Jiang G, Niu S. miR-125a-5p inhibits colorectal cancer cell epithelial-mesenchymal transition, invasion and migration by targeting TAZ. Onco Targets Ther 2019; 12:3481-9. doi: 10.2147/ott.s191247 [Crossref] [ Google Scholar]
- Deiuliis JA. MicroRNAs as regulators of metabolic disease: pathophysiologic significance and emerging role as biomarkers and therapeutics. Int J Obes (Lond) 2016; 40(1):88-101. doi: 10.1038/ijo.2015.170 [Crossref] [ Google Scholar]
- Holley CL, Topkara VK. An introduction to small non-coding RNAs: miRNA and snoRNA. Cardiovasc Drugs Ther 2011; 25(2):151-9. doi: 10.1007/s10557-011-6290-z [Crossref] [ Google Scholar]
- Portius D, Sobolewski C, Foti M. MicroRNAs-dependent regulation of PPARs in metabolic diseases and cancers. PPAR Res 2017; 2017:7058424. doi: 10.1155/2017/7058424 [Crossref] [ Google Scholar]
- Cui M, Wang H, Yao X, Zhang D, Xie Y, Cui R. Circulating MicroRNAs in cancer: potential and challenge. Front Genet 2019; 10:626. doi: 10.3389/fgene.2019.00626 [Crossref] [ Google Scholar]
- Kibel AS. Commentary on Circulating microRNAs as stable blood-based markers for cancer detection: Mitchell PS, Parkin RK, Kroh EM, Fritz BR, Wyman SK, Pogosova-Agadjanyan EL, Peterson A, Noteboom J, O’Briant KC, Allen A, Lin DW, Urban N, Drescher CW, Knudsen, Stirewalt DL, Gentleman R, Vessella RL, Nelson PS, Martin DB, Tewari M, Divisions of Human Biology, Clinical Research, and Public Health Services, Fred Hutchinson Cancer Research Center, Seattle, WA. Urol Oncol 2009; 27(4):461. doi: 10.1016/j.urolonc.2009.04.001 [Crossref] [ Google Scholar]
- Bartel DP. MicroRNAs: genomics, biogenesis, mechanism, and function. Cell 2004; 116(2):281-97. doi: 10.1016/s0092-8674(04)00045-5 [Crossref] [ Google Scholar]
- Arroyo JD, Chevillet JR, Kroh EM, Ruf IK, Pritchard CC, Gibson DF. Argonaute2 complexes carry a population of circulating microRNAs independent of vesicles in human plasma. Proc Natl Acad Sci U S A 2011; 108(12):5003-8. doi: 10.1073/pnas.1019055108 [Crossref] [ Google Scholar]
- Cheng G. Circulating miRNAs: roles in cancer diagnosis, prognosis and therapy. Adv Drug Deliv Rev 2015; 81:75-93. doi: 10.1016/j.addr.2014.09.001 [Crossref] [ Google Scholar]
- Wang H, Peng R, Wang J, Qin Z, Xue L. Circulating microRNAs as potential cancer biomarkers: the advantage and disadvantage. Clin Epigenetics 2018; 10:59. doi: 10.1186/s13148-018-0492-1 [Crossref] [ Google Scholar]
- Swan AL, Mobasheri A, Allaway D, Liddell S, Bacardit J. Application of machine learning to proteomics data: classification and biomarker identification in postgenomics biology. OMICS 2013; 17(12):595-610. doi: 10.1089/omi.2013.0017 [Crossref] [ Google Scholar]
- Mahadevan S, Shah SL, Marrie TJ, Slupsky CM. Analysis of metabolomic data using support vector machines. Anal Chem 2008; 80(19):7562-70. doi: 10.1021/ac800954c [Crossref] [ Google Scholar]
- Yin LJ, Wang C, Hu YY, Chen DZ, Xu JF, Liu J. AHP-based approach for optimization of waste disposal method in urban functional zone. Environ Technol 2017; 38(13-14):1689-95. doi: 10.1080/09593330.2016.1244565 [Crossref] [ Google Scholar]
- Cortes C, Vapnik V. Support-vector networks. Mach Learn 1995; 20(3):273-97. doi: 10.1007/bf00994018 [Crossref] [ Google Scholar]
- Hao L, Greer T, Page D, Shi Y, Vezina CM, Macoska JA. In-depth characterization and validation of human urine metabolomes reveal novel metabolic signatures of lower urinary tract symptoms. Sci Rep 2016; 6:30869. doi: 10.1038/srep30869 [Crossref] [ Google Scholar]
- Taherkhani A, Kalantari S, Arefi Oskouie A, Nafar M, Taghizadeh M, Tabar K. Network analysis of membranous glomerulonephritis based on metabolomics data. Mol Med Rep 2018; 18(5):4197-212. doi: 10.3892/mmr.2018.9477 [Crossref] [ Google Scholar]
- Debnath M, Prasad GB, Bisen PS. Omics technology. In: Molecular Diagnostics: Promises and Possibilities. Dordrecht: Springer; 2010. p. 11-31.
- Kojima M, Sudo H, Kawauchi J, Takizawa S, Kondou S, Nobumasa H. MicroRNA markers for the diagnosis of pancreatic and biliary-tract cancers. PLoS One 2015; 10(2):e0118220. doi: 10.1371/journal.pone.0118220 [Crossref] [ Google Scholar]
- Calderone A, Castagnoli L, Cesareni G. Mentha: a resource for browsing integrated protein-interaction networks. Nat Methods 2013; 10(8):690-1. doi: 10.1038/nmeth.2561 [Crossref] [ Google Scholar]
- Breuer K, Foroushani AK, Laird MR, Chen C, Sribnaia A, Lo R. InnateDB: systems biology of innate immunity and beyond--recent updates and continuing curation. Nucleic Acids Res 2013; 41(Database issue):D1228-33. doi: 10.1093/nar/gks1147 [Crossref] [ Google Scholar]
- Mendez D, Gaulton A, Bento AP, Chambers J, De Veij M, Félix E. ChEMBL: towards direct deposition of bioassay data. Nucleic Acids Res 2019; 47(D1):D930-D40. doi: 10.1093/nar/gky1075 [Crossref] [ Google Scholar]
- Croft D, O’Kelly G, Wu G, Haw R, Gillespie M, Matthews L. Reactome: a database of reactions, pathways and biological processes. Nucleic Acids Res 2011; 39(Database issue):D691-7. doi: 10.1093/nar/gkq1018 [Crossref] [ Google Scholar]
- Barrett T, Wilhite SE, Ledoux P, Evangelista C, Kim IF, Tomashevsky M. NCBI GEO: archive for functional genomics data sets--update. Nucleic Acids Res 2013; 41(Database issue):D991-5. doi: 10.1093/nar/gks1193 [Crossref] [ Google Scholar]
- Taherkhani A, Farrokhi Yekta R, Mohseni M, Saidijam M, Arefi Oskouie A. Chronic kidney disease: a review of proteomic and metabolomic approaches to membranous glomerulonephritis, focal segmental glomerulosclerosis, and IgA nephropathy biomarkers. Proteome Sci 2019; 17:7. doi: 10.1186/s12953-019-0155-y [Crossref] [ Google Scholar]
- Bartel J, Krumsiek J, Theis FJ. Statistical methods for the analysis of high-throughput metabolomics data. Comput Struct Biotechnol J 2013; 4:e201301009. doi: 10.5936/csbj.201301009 [Crossref] [ Google Scholar]
- Kallio MA, Tuimala JT, Hupponen T, Klemelä P, Gentile M, Scheinin I. Chipster: user-friendly analysis software for microarray and other high-throughput data. BMC Genomics 2011; 12:507. doi: 10.1186/1471-2164-12-507 [Crossref] [ Google Scholar]
- Dweep H, Gretz N. miRWalk20: a comprehensive atlas of microRNA-target interactions. Nat Methods 2015; 12(8):697. doi: 10.1038/nmeth.3485 [Crossref] [ Google Scholar]
- Hao T, Peng W, Wang Q, Wang B, Sun J. Reconstruction and application of protein-protein interaction network. Int J Mol Sci 2016; 17(6). doi: 10.3390/ijms17060907 [Crossref]
- Zali H, Rezaei Tavirani M. Meningioma protein-protein interaction network. Arch Iran Med 2014; 17(4):262-72. [ Google Scholar]
- Saito R, Smoot ME, Ono K, Ruscheinski J, Wang PL, Lotia S. A travel guide to Cytoscape plugins. Nat Methods 2012; 9(11):1069-76. doi: 10.1038/nmeth.2212 [Crossref] [ Google Scholar]
- Bader GD, Hogue CW. An automated method for finding molecular complexes in large protein interaction networks. BMC Bioinformatics 2003; 4:2. doi: 10.1186/1471-2105-4-2 [Crossref] [ Google Scholar]
- Jassal B, Matthews L, Viteri G, Gong C, Lorente P, Fabregat A. The reactome pathway knowledgebase. Nucleic Acids Res 2020; 48(D1):D498-D503. doi: 10.1093/nar/gkz1031 [Crossref] [ Google Scholar]
- Bindea G, Mlecnik B, Hackl H, Charoentong P, Tosolini M, Kirilovsky A. ClueGO: a Cytoscape plug-in to decipher functionally grouped gene ontology and pathway annotation networks. Bioinformatics 2009; 25(8):1091-3. doi: 10.1093/bioinformatics/btp101 [Crossref] [ Google Scholar]
- Mi H, Muruganujan A, Thomas PD. PANTHER in 2013: modeling the evolution of gene function, and other gene attributes, in the context of phylogenetic trees. Nucleic Acids Res 2013; 41(Database issue):D377-86. doi: 10.1093/nar/gks1118 [Crossref] [ Google Scholar]
- Janky R, Verfaillie A, Imrichová H, Van de Sande B, Standaert L, Christiaens V. iRegulon: from a gene list to a gene regulatory network using large motif and track collections. PLoS Comput Biol 2014; 10(7):e1003731. doi: 10.1371/journal.pcbi.1003731 [Crossref] [ Google Scholar]
- Taherkhani A, Kalantari S, Nafar M. Prediction of molecular signature, potential biomarkers, and molecular pathways associated with membranous nephropathy based on protein protein interactions. Rev Invest Clin 2018; 70(4):184-91. doi: 10.24875/ric.18002551 [Crossref] [ Google Scholar]
- Hong W, Hu Y, Fan Z, Gao R, Yang R, Bi J. In silico identification of EP400 and TIA1 as critical transcription factors involved in human hepatocellular carcinoma relapse. Oncol Lett 2020; 19(1):952-64. doi: 10.3892/ol.2019.11171 [Crossref] [ Google Scholar]
- Huang S, Cai N, Pacheco PP, Narrandes S, Wang Y, Xu W. Applications of Support Vector Machine (SVM) Learning in Cancer Genomics. Cancer Genomics Proteomics 2018; 15(1):41-51. doi: 10.21873/cgp.20063 [Crossref] [ Google Scholar]
- Yu C, Chen F, Jiang J, Zhang H, Zhou M. Screening key genes and signaling pathways in colorectal cancer by integrated bioinformatics analysis. Mol Med Rep 2019; 20(2):1259-69. doi: 10.3892/mmr.2019.10336 [Crossref] [ Google Scholar]
- Wilke CO. Bringing molecules back into molecular evolution. PLoS Comput Biol 2012; 8(6):e1002572. doi: 10.1371/journal.pcbi.1002572 [Crossref] [ Google Scholar]
- Zhu FF, Yang LZ. Bioinformatic analysis identifies potentially key differentially expressed genes and pathways in orbital adipose tissues of patients with thyroid eye disease. Acta Endocrinol (Buchar) 2019; 15(1):1-8. doi: 10.4183/aeb.2019.1 [Crossref] [ Google Scholar]
- Bokoch GM. Biology of the p21-activated kinases. Annu Rev Biochem 2003; 72:743-81. doi: 10.1146/annurev.biochem.72.121801.161742 [Crossref] [ Google Scholar]
- Kumar R, Gururaj AE, Barnes CJ. p21-activated kinases in cancer. Nat Rev Cancer 2006; 6(6):459-71. doi: 10.1038/nrc1892 [Crossref] [ Google Scholar]
- Marlin JW, Chang YW, Ober M, Handy A, Xu W, Jakobi R. Functional PAK-2 knockout and replacement with a caspase cleavage-deficient mutant in mice reveals differential requirements of full-length PAK-2 and caspase-activated PAK-2p34. Mamm Genome 2011; 22(5-6):306-17. doi: 10.1007/s00335-011-9326-6 [Crossref] [ Google Scholar]
- Lee N, MacDonald H, Reinhard C, Halenbeck R, Roulston A, Shi T. Activation of hPAK65 by caspase cleavage induces some of the morphological and biochemical changes of apoptosis. Proc Natl Acad Sci U S A 1997; 94(25):13642-7. doi: 10.1073/pnas.94.25.13642 [Crossref] [ Google Scholar]
- Jakobi R, McCarthy CC, Koeppel MA, Stringer DK. Caspase-activated PAK-2 is regulated by subcellular targeting and proteasomal degradation. J Biol Chem 2003; 278(40):38675-85. doi: 10.1074/jbc.M306494200 [Crossref] [ Google Scholar]
- Kyritsi EM, Sertedaki A, Charmandari E, Chrousos GP. Familial or sporadic adrenal hypoplasia syndromes. In: Feingold KR, Anawalt B, Boyce A, Chrousos G, de Herder WW, Dungan K, et al, eds. In: Endotext. South Dartmouth, MA: MDText.com, Inc; 2000.
- Boutet E, Lieberherr D, Tognolli M, Schneider M, Bairoch A. UniProtKB/Swiss-Prot. In: Edwards D, ed. Plant Bioinformatics: Methods and Protocols. Totowa, NJ: Springer; 2007. p. 89-112.
- Nikonova AS, Astsaturov I, Serebriiskii IG, Dunbrack RL Jr, Golemis EA. Aurora A kinase (AURKA) in normal and pathological cell division. Cell Mol Life Sci 2013; 70(4):661-87. doi: 10.1007/s00018-012-1073-7 [Crossref] [ Google Scholar]
- Bischoff JR, Anderson L, Zhu Y, Mossie K, Ng L, Souza B. A homologue of Drosophila aurora kinase is oncogenic and amplified in human colorectal cancers. EMBO J 1998; 17(11):3052-65. doi: 10.1093/emboj/17.11.3052 [Crossref] [ Google Scholar]
- Zhou H, Kuang J, Zhong L, Kuo WL, Gray JW, Sahin A. Tumour amplified kinase STK15/BTAK induces centrosome amplification, aneuploidy and transformation. Nat Genet 1998; 20(2):189-93. doi: 10.1038/2496 [Crossref] [ Google Scholar]
- Gritsko TM, Coppola D, Paciga JE, Yang L, Sun M, Shelley SA. Activation and overexpression of centrosome kinase BTAK/Aurora-A in human ovarian cancer. Clin Cancer Res 2003; 9(4):1420-6. [ Google Scholar]
- Lam AK, Ong K, Ho YH. Aurora kinase expression in colorectal adenocarcinoma: correlations with clinicopathological features, p16 expression, and telomerase activity. Hum Pathol 2008; 39(4):599-604. doi: 10.1016/j.humpath.2007.09.001 [Crossref] [ Google Scholar]
- Dotan E, Meropol NJ, Zhu F, Zambito F, Bove B, Cai KQ. Relationship of increased aurora kinase A gene copy number, prognosis and response to chemotherapy in patients with metastatic colorectal cancer. Br J Cancer 2012; 106(4):748-55. doi: 10.1038/bjc.2011.587 [Crossref] [ Google Scholar]
- Zhang C, Qu L, Lian S, Meng L, Min L, Liu J. PRL-3 promotes ubiquitination and degradation of AURKA and colorectal cancer progression via dephosphorylation of FZR1. Cancer Res 2019; 79(5):928-40. doi: 10.1158/0008-5472.can-18-0520 [Crossref] [ Google Scholar]
- Kernan JL, Martinez-Chacin RC, Wang X, Tiedemann RL, Bonacci T, Choudhury R, et al. In silico APC/C substrate discovery reveals cell cycle degradation of chromatin regulators including UHRF1. bioRxiv. 2020. 10.1101/2020.04.09.033621
- Moshe Y, Bar-On O, Ganoth D, Hershko A. Regulation of the action of early mitotic inhibitor 1 on the anaphase-promoting complex/cyclosome by cyclin-dependent kinases. J Biol Chem 2011; 286(19):16647-57. doi: 10.1074/jbc.M111.223339 [Crossref] [ Google Scholar]
- Machida YJ, Dutta A. The APC/C inhibitor, Emi1, is essential for prevention of rereplication. Genes Dev 2007; 21(2):184-94. doi: 10.1101/gad.1495007 [Crossref] [ Google Scholar]
- Chao TC, Chen KJ, Tang MC, Chan LC, Chen PM, Tzeng CH. Thymosin beta-4 knockdown in IEC-6 normal intestinal epithelial cells induces DNA re-replication via downregulating Emi1. J Cell Physiol 2014; 229(11):1639-46. doi: 10.1002/jcp.24609 [Crossref] [ Google Scholar]
- Chae YC, Vaira V, Caino MC, Tang HY, Seo JH, Kossenkov AV. Mitochondrial Akt regulation of hypoxic tumor reprogramming. Cancer Cell 2016; 30(2):257-72. doi: 10.1016/j.ccell.2016.07.004 [Crossref] [ Google Scholar]
- Dai Z, Pan S, Chen C, Cao L, Li X, Chen X. Down-regulation of succinate dehydrogenase subunit B and up-regulation of pyruvate dehydrogenase kinase 1 predicts poor prognosis in recurrent nasopharyngeal carcinoma. Tumour Biol 2016; 37(4):5145-52. doi: 10.1007/s13277-015-4107-6 [Crossref] [ Google Scholar]
- Kaplon J, Zheng L, Meissl K, Chaneton B, Selivanov VA, Mackay G. A key role for mitochondrial gatekeeper pyruvate dehydrogenase in oncogene-induced senescence. Nature 2013; 498(7452):109-12. doi: 10.1038/nature12154 [Crossref] [ Google Scholar]
- Qin L, Tian Y, Yu Z, Shi D, Wang J, Zhang C. Targeting PDK1 with dichloroacetophenone to inhibit acute myeloid leukemia (AML) cell growth. Oncotarget 2016; 7(2):1395-407. doi: 10.18632/oncotarget.6366 [Crossref] [ Google Scholar]
- Zhang W, Su J, Xu H, Yu S, Liu Y, Zhang Y. Dicumarol inhibits PDK1 and targets multiple malignant behaviors of ovarian cancer cells. PLoS One 2017; 12(6):e0179672. doi: 10.1371/journal.pone.0179672 [Crossref] [ Google Scholar]
- Qin W, Tian Y, Zhang J, Liu W, Zhou Q, Hu S. The double inhibition of PDK1 and STAT3-Y705 prevents liver metastasis in colorectal cancer. Sci Rep 2019; 9(1):12973. doi: 10.1038/s41598-019-49480-8 [Crossref] [ Google Scholar]
- Kapeli K, Martinez FJ, Yeo GW. Genetic mutations in RNA-binding proteins and their roles in ALS. Hum Genet 2017; 136(9):1193-214. doi: 10.1007/s00439-017-1830-7 [Crossref] [ Google Scholar]
- Yue M, Li Q, Zhang Y, Zhao Y, Zhang Z, Bao S. Histone H4R3 methylation catalyzed by SKB1/PRMT5 is required for maintaining shoot apical meristem. PLoS One 2013; 8(12):e83258. doi: 10.1371/journal.pone.0083258 [Crossref] [ Google Scholar]
- Kondo Y, Oubridge C, van Roon AM, Nagai K. Crystal structure of human U1 snRNP, a small nuclear ribonucleoprotein particle, reveals the mechanism of 5’ splice site recognition. Elife 2015; 4. doi: 10.7554/eLife.04986 [Crossref]
- Agafonov DE, Kastner B, Dybkov O, Hofele RV, Liu WT, Urlaub H. Molecular architecture of the human U4/U6U5 tri-snRNP. Science 2016; 351(6280):1416-20. doi: 10.1126/science.aad2085 [Crossref] [ Google Scholar]
- Rebhan M, Chalifa-Caspi V, Prilusky J, Lancet D. GeneCards: integrating information about genes, proteins and diseases. Trends Genet 1997; 13(4):163. doi: 10.1016/s0168-9525(97)01103-7 [Crossref] [ Google Scholar]
- Anchi T, Tamura K, Furihata M, Satake H, Sakoda H, Kawada C. SNRPE is involved in cell proliferation and progression of high-grade prostate cancer through the regulation of androgen receptor expression. Oncol Lett 2012; 3(2):264-8. doi: 10.3892/ol.2011.505 [Crossref] [ Google Scholar]
- Jones PG, Lombardi SJ, Cockett MI. Cloning and tissue distribution of the human G protein beta 5 cDNA. Biochim Biophys Acta 1998; 1402(3):288-91. doi: 10.1016/s0167-4889(98)00017-2 [Crossref] [ Google Scholar]
- Shamseldin HE, Masuho I, Alenizi A, Alyamani S, Patil DN, Ibrahim N. GNB5 mutation causes a novel neuropsychiatric disorder featuring attention deficit hyperactivity disorder, severely impaired language development and normal cognition. Genome Biol 2016; 17(1):195. doi: 10.1186/s13059-016-1061-6 [Crossref] [ Google Scholar]
- Lodder EM, De Nittis P, Koopman CD, Wiszniewski W, Moura de Souza CF, Lahrouchi N. GNB5 mutations cause an autosomal-recessive multisystem syndrome with sinus bradycardia and cognitive disability. Am J Hum Genet 2016; 99(3):704-10. doi: 10.1016/j.ajhg.2016.06.025 [Crossref] [ Google Scholar]
- Park SM, Hwang CY, Cho SH, Lee D, Gong JR, Lee S. Systems analysis identifies potential target genes to overcome cetuximab resistance in colorectal cancer cells. FEBS J 2019; 286(7):1305-18. doi: 10.1111/febs.14773 [Crossref] [ Google Scholar]
- Tanaka A, Zhou Y, Ogawa M, Shia J, Klimstra DS, Wang JY. STAT1 as a potential prognosis marker for poor outcomes of early stage colorectal cancer with microsatellite instability. PLoS One 2020; 15(4):e0229252. doi: 10.1371/journal.pone.0229252 [Crossref] [ Google Scholar]
- Chin YE, Kitagawa M, Kuida K, Flavell RA, Fu XY. Activation of the STAT signaling pathway can cause expression of caspase 1 and apoptosis. Mol Cell Biol 1997; 17(9):5328-37. doi: 10.1128/mcb.17.9.5328 [Crossref] [ Google Scholar]
- Kumar A, Commane M, Flickinger TW, Horvath CM, Stark GR. Defective TNF-alpha-induced apoptosis in STAT1-null cells due to low constitutive levels of caspases. Science 1997; 278(5343):1630-2. doi: 10.1126/science.278.5343.1630 [Crossref] [ Google Scholar]
- Stephanou A, Brar BK, Knight RA, Latchman DS. Opposing actions of STAT-1 and STAT-3 on the Bcl-2 and Bcl-x promoters. Cell Death Differ 2000; 7(3):329-30. doi: 10.1038/sj.cdd.4400656 [Crossref] [ Google Scholar]
- Hix LM, Karavitis J, Khan MW, Shi YH, Khazaie K, Zhang M. Tumor STAT1 transcription factor activity enhances breast tumor growth and immune suppression mediated by myeloid-derived suppressor cells. J Biol Chem 2013; 288(17):11676-88. doi: 10.1074/jbc.M112.441402 [Crossref] [ Google Scholar]
- Brueckner LM, Hess EM, Schwab M, Savelyeva L. Instability at the FRA8I common fragile site disrupts the genomic integrity of the KIAA0146, CEBPD and PRKDC genes in colorectal cancer. Cancer Lett 2013; 336(1):85-95. doi: 10.1016/j.canlet.2013.04.007 [Crossref] [ Google Scholar]
- Sarkar TR, Sharan S, Wang J, Pawar SA, Cantwell CA, Johnson PF. Identification of a Src tyrosine kinase/SIAH2 E3 ubiquitin ligase pathway that regulates C/EBPδ expression and contributes to transformation of breast tumor cells. Mol Cell Biol 2012; 32(2):320-32. doi: 10.1128/mcb.05790-11 [Crossref] [ Google Scholar]
- Wang J, Sarkar TR, Zhou M, Sharan S, Ritt DA, Veenstra TD. CCAAT/enhancer binding protein delta (C/EBPdelta, CEBPD)-mediated nuclear import of FANCD2 by IPO4 augments cellular response to DNA damage. Proc Natl Acad Sci U S A 2010; 107(37):16131-6. doi: 10.1073/pnas.1002603107 [Crossref] [ Google Scholar]